Fig. 8.

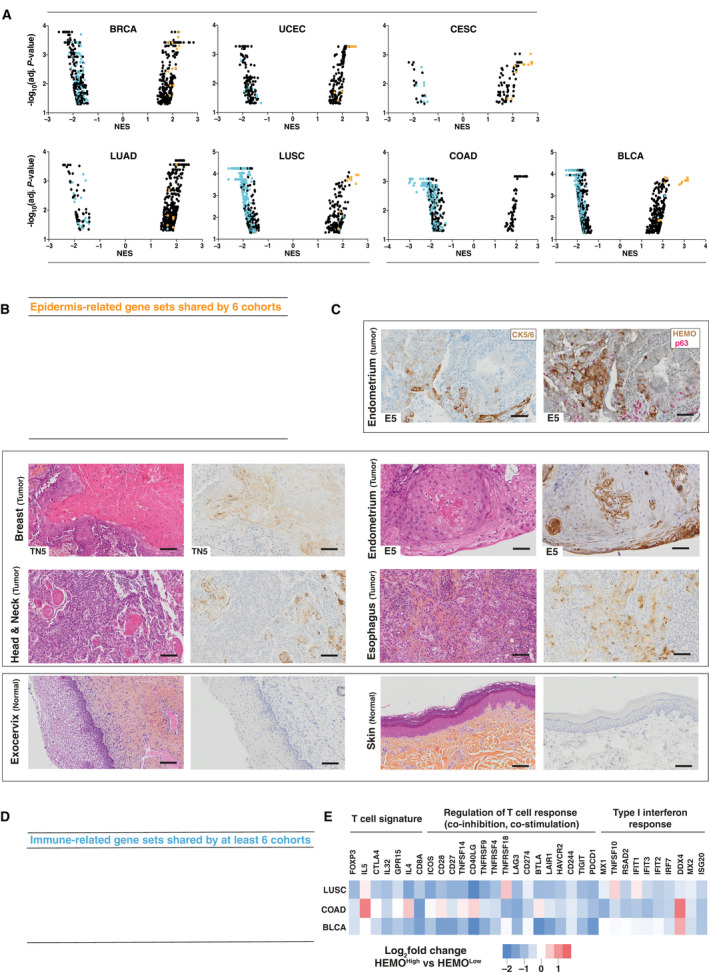
HEMO activation in tumors is linked to epidermis and immune‐related signatures. (A) GSEA (Gene Ontology Biological Process and REACTOME) pathway distribution for HEMOHigh vs HEMOLow tumors in TCGA cohorts. Of note, for each cohort, these two groups displayed similar tumor cellularity. Immune response‐ and epidermis‐related gene sets are, respectively, demarcated as blue and orange dots. NES: Normalized Enrichment Score. (B) List of epidermis‐related gene sets shared by six cohorts (absence of such gene sets in the COAD cohort). (C) Top: Endometrium adenocarcinoma sample stained with CK5/6 (left) or HEMO (brown) and p63 (pink) (right), magnification: 15×, scale bar: 100 μm. Middle: pairs of HES and anti‐HEMO staining in differentiated squamous tumors of breast, endometrium, Head and Neck with peculiar localization of HEMO in squamous pearls and esophagus. Bottom: pairs of HES and anti‐HEMO staining in normal tissue of exocervix and skin. Magnification: 10×, scale bar: 100 μm. When specified, numbers correspond to samples analyzed in Fig. 4. (D) List of immune‐related gene sets shared by 6 or 7 cohorts. (E) Heatmap displaying differential expression between HEMOHigh and HEMOLow tumors, of immune‐related genes belonging to ‘T‐cell (Treg and CD8)’, ‘Regulation of immune response’ and ‘Type I interferon response’ signatures established by [47]. PDCD1 was also added on this figure. Color gradation is representative of Log2 fold change.
