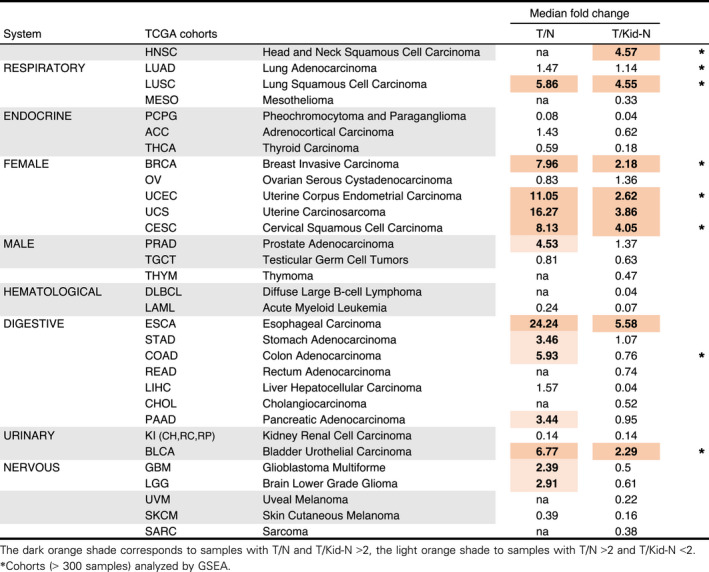
Table 1.
Relative expression level of HEMO in tumor samples compared to normal tissue samples. Median fold change (based on TPM values), between the medians of normal‐GTEx and tumor‐TCGA samples for each cohort (T/N), and between the medians of kidney normal‐GTEx and other tumor‐TCGA samples (T/Kid‐N). KI (CH, RC, RP): Kidney cohort aggregated from KICH (Kidney Chromophobe), KIRC (Kidney Renal Clear Cell Carcinoma) and KIRP (Kidney Renal Papillary Cell Carcinoma). Fold changes > 2 are in bold.

