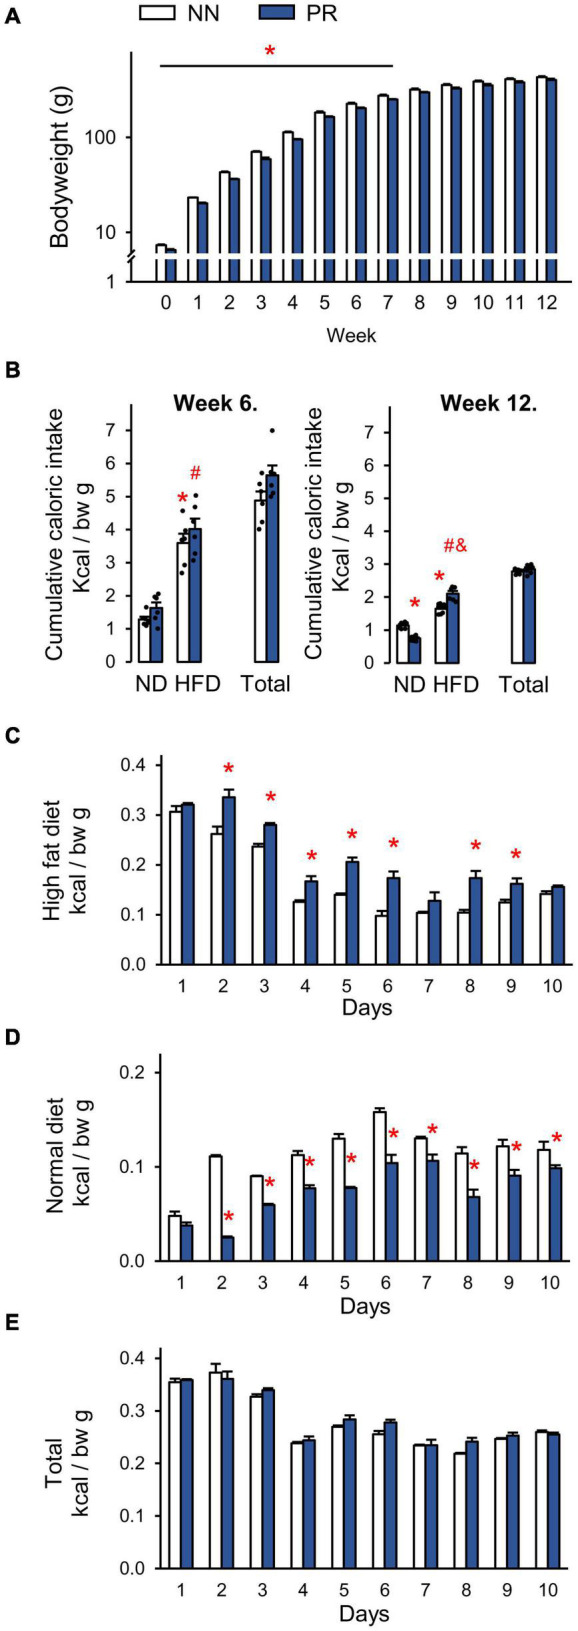
FIGURE 1.

Postnatal development of normal nourished (NN) and intrauterine protein restricted (PR) rats as well as relative caloric intakes of normal (ND) and high fat (HFD) diets. (A) Weekly bodyweights. PR rats had lower than normal bodyweight at birth (week 0) and until week 8. Student’s t-test, or Mann-Whitney U-test, NN vs. PR *p < 0.05, n = 6. Note the logarithmic scale on the y axis. (B) Caloric intakes of ND and HFD. Both diets were offered for 10 days as a free choice. Both NN and PR rats prefer HFD over ND at postnatal week 6 (left, catch up growth period) and postnatal week 12 (right, catch up growth completed). At postnatal week 12 PR rats consume relatively more of HFD and less of ND than NN rats. The total caloric intake of PR rats is normal. ND—HFD bars: Two-way ANOVA, week 6: effect of diet: F(1, 20) = 101.87, p < 0.001, week 12: phenotype × diet: F(1, 20) = 49.01, p < 0.001. Tukey multiple comparison test, *p < 0.001 vs. NN-ND, #p < 0.001 vs. PR-ND, &p < 0.001 vs. NN-HFD. (C–E) Relative daily caloric intakes during the fat preference test performed at postnatal week 12. (C) HFD. Two-way RM ANOVA, effect of time: F(9, 90) = 286.90, p < 0.001, effect of phenotype: F(1, 90) = 19,28, p < 0.001, phenotype × time: F(9, 90) = 8.48, p < 0.001. (D) ND. Two-way RM ANOVA, effect of time: F(9, 90) = 107.81, p < 0.001, effect of phenotype: F(1, 90) = 51.06, p < 0.001, phenotype × time: F(9, 90) = 20.03, p < 0.001. (E) HFD + ND as total. Two-way RM ANOVA, effect of time: F(9, 90) = 168.83, p < 0.001. Tukey multiple comparison tests, NN vs. PR within day *p < 0.01. Means ± SEM, n = 6 for all graphs. bw: bodyweight.
