FIGURE 2.
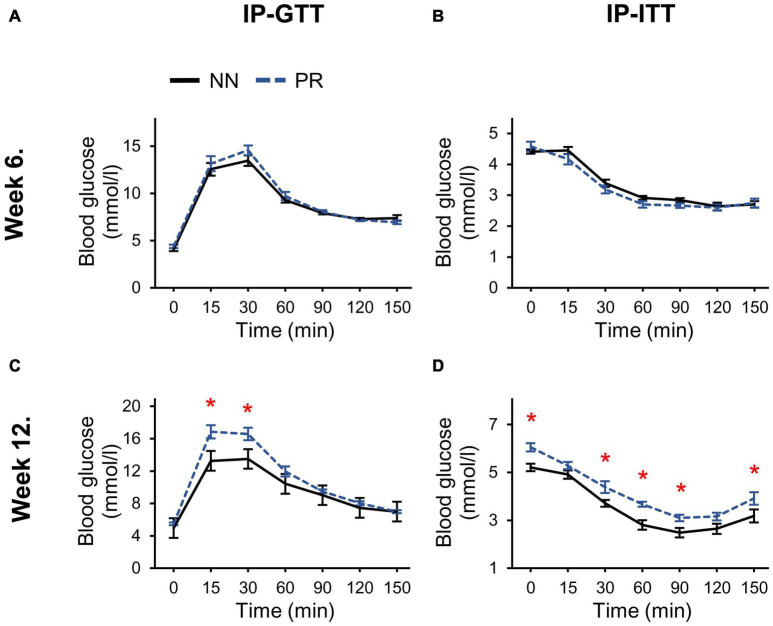
Glucose and insulin tolerances of NN and PR rats. (A) Intraperitoneal glucose (IP-GTT) and (B) intraperitoneal insulin tolerance tests (IP-ITT) performed at postnatal week 6 show similar responses to glucose and insulin in both groups. (C) IP-GTT performed at postnatal week 12 shows decreased glucose tolerance of PR rats. Two-way RM ANOVA, effect of phenotype: F(1, 78) = 6.494, p = 0.023, effect of time: F(6, 78) = 87.342, p < 0.001, effect of phenotype × time: F(6, 78) = 2.972, p = 0.011. (D) IP-ITT shows decreased insulin sensitivity of PR rats compared to NN controls. Two-way RM ANOVA, effect of phenotype: F(1, 81) = 18.714, p < 0.001, effect of time: F(6, 81) = 93.725, p < 0.001. Tukey multiple comparison tests, NN vs. PR within one time point, *p < 0.05. Means ± SEM, n = 8 for all graphs.

