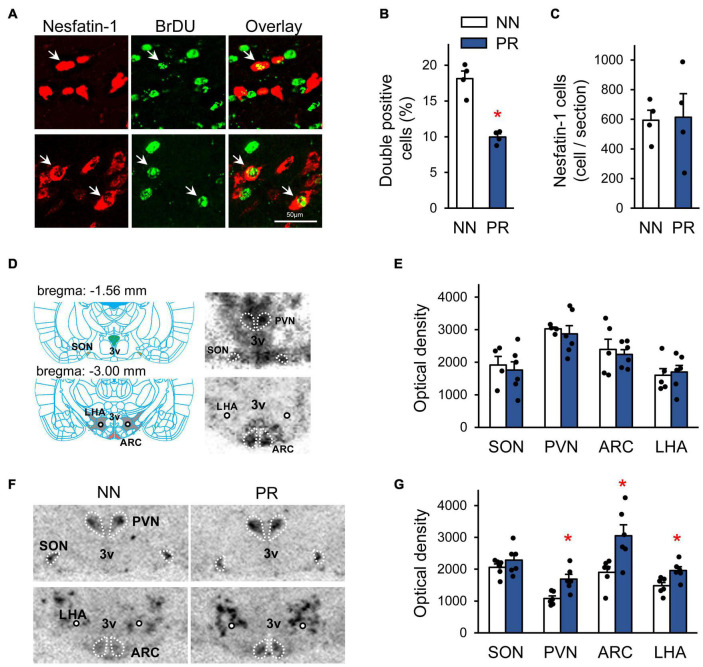
FIGURE 3.
Characterization of the peripheral and central nesfatin-1 system. (A) Birth dating of nesfatin-1 neurons by bromodeoxyuridine (BrDU) at the embryonic day 13 (E13). Confocal microscopic images showing nesfatin-1 and BrDU double-labeled cells (arrows) in the hypothalamus of a NN rat. The immunostaining was performed using coronal hypothalamic sections of adult offspring. (B) Percentage of nesfatin-1 cells generated at E13 (BrDU and nesfatin-1 double-labeled cells) in the hypothalamus. Two-way RM-ANOVA, effect of phenotype F(1, 2) = 71.83, *p = 0.014, n = 2 animals and 4 sections/group. (C) The number of hypothalamic nesfatin-1 positive cells in adults. n = 4 animals/group. (D) Left: Schematic (Paxinos and Watson, 2007) showing the location of the investigated hypothalamic nuclei in coronal brain sections. The rostro-caudal distance from the bregma level is indicated for each section. ARC, arcuate nucleus; PVN, paraventricular nucleus; SON, supraoptic nucleus; LHA, lateral hypothalamic area; 3V, 3rd ventricle; circle, fornix. Right: Detection of NUCB2/nesfatin-1 mRNA by radioactive in situ hybridization technique in the investigated areas in neonatal rats. Autoradiographic images (NN rat) of coronal sections. The darker the shades of gray, the stronger the signal. (E) Bar graph showing NUCB2/nesfatin-1 mRNA levels in the investigated nuclei in neonates, n = 4–6. (F) Autoradiographic images showing NUCB2/nesfatin-1 mRNA expression in adult NN and PR rats. Note the enhanced signal intensity in most of the measured nuclei in the PR rat. (G) Bar graph showing NUCB2/nesfatin-1 mRNA levels in the investigated areas in adults. Student’s t-test, or Mann-Whitney U-test, NN vs. PR *p < 0.05, n = 6. Bar graphs show means ± SEM.

