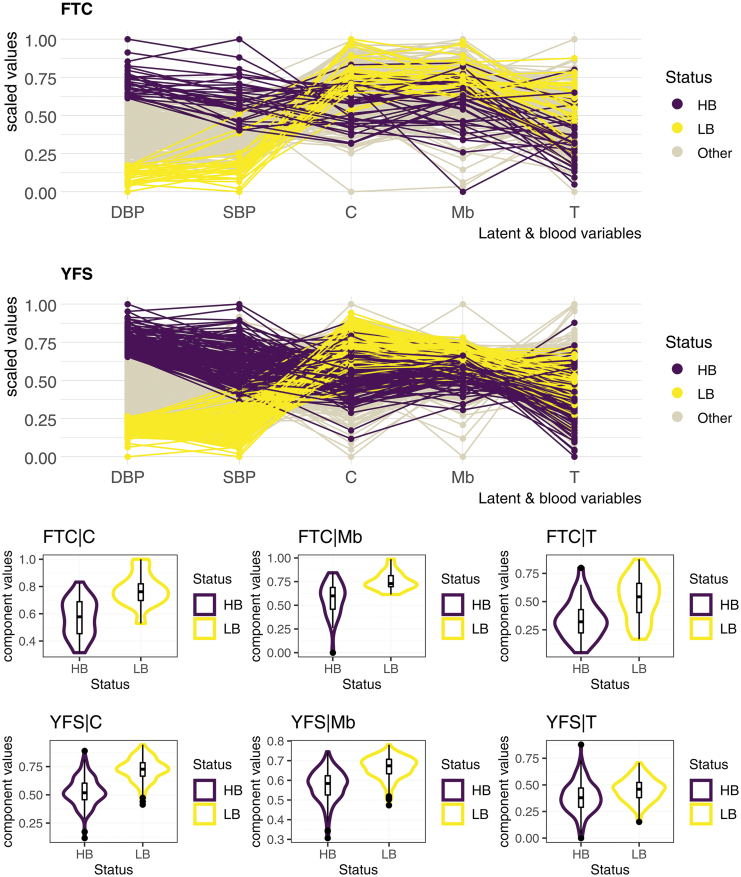
FIG. 2.
Projection of participants of both cohorts on each block-related component. Despite strong differences in the distribution of diastolic (and systolic) blood pressure between the two cohorts (Table 1 and Supplementary Document, Section S4), the three-block model distributed the first and last decile participants fairly distinctly over its block-related components. The transcriptomic component, however, lost some of its strength in that the distributions of the first and last decile on the YFS cohort are considerably closer. Blood measures and block-related components were scaled in each of the two cohorts to obtain this figure. C, clinical_PRS; HB, last decile; LB, first decile; Mb, metabolomics; PRS, polygenic risk scores; T, transcriptomics; YFS, Young Finns Study.

