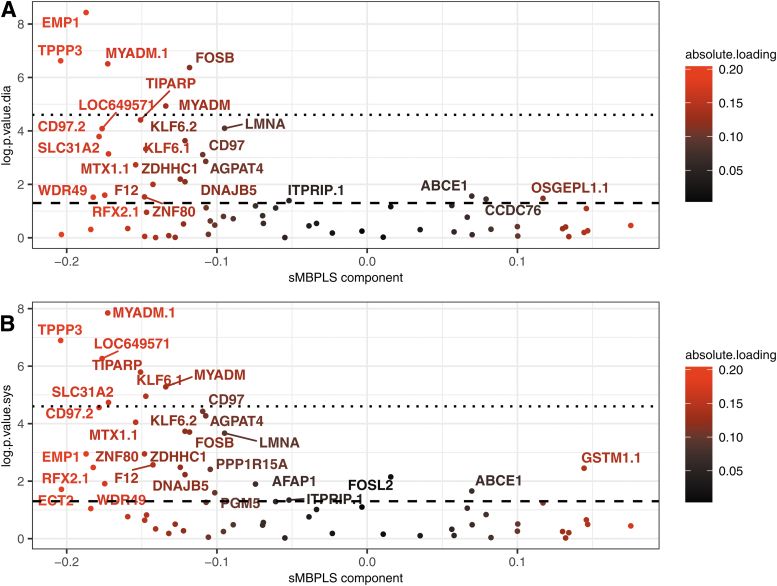
FIG. 3.
Transcriptomic loadings compared with p-values in Spearman's correlation nullity test in corrected SBP and DBP applied on YFS participants. Genes contributing the most to the creation of the transcriptomic component, that is, having high loading factors in absolute value, tended to have low Spearman's correlation nullity test p-values compared with SBP and DBP controlled by age, sex, and BMI. The axis log.p.value.sys on plot (B) (resp. log.p.value.dia on plot (A) refers, respectively, to the negative logarithm to base 10 of the p-value obtained in the Spearman correlation nullity test between each transcriptomic variable and systolic (resp. diastolic) blood pressure controlled by age, sex, and BMI in the YFS test cohort. The absolute.loading coloring refers to the absolute factor loading value of each gene in the modeling. The semi-full line refers to the negative logarithm to base 10 of the 5% p-value threshold while the dashed line refers to the Bonferroni threshold. BMI, body mass index.

