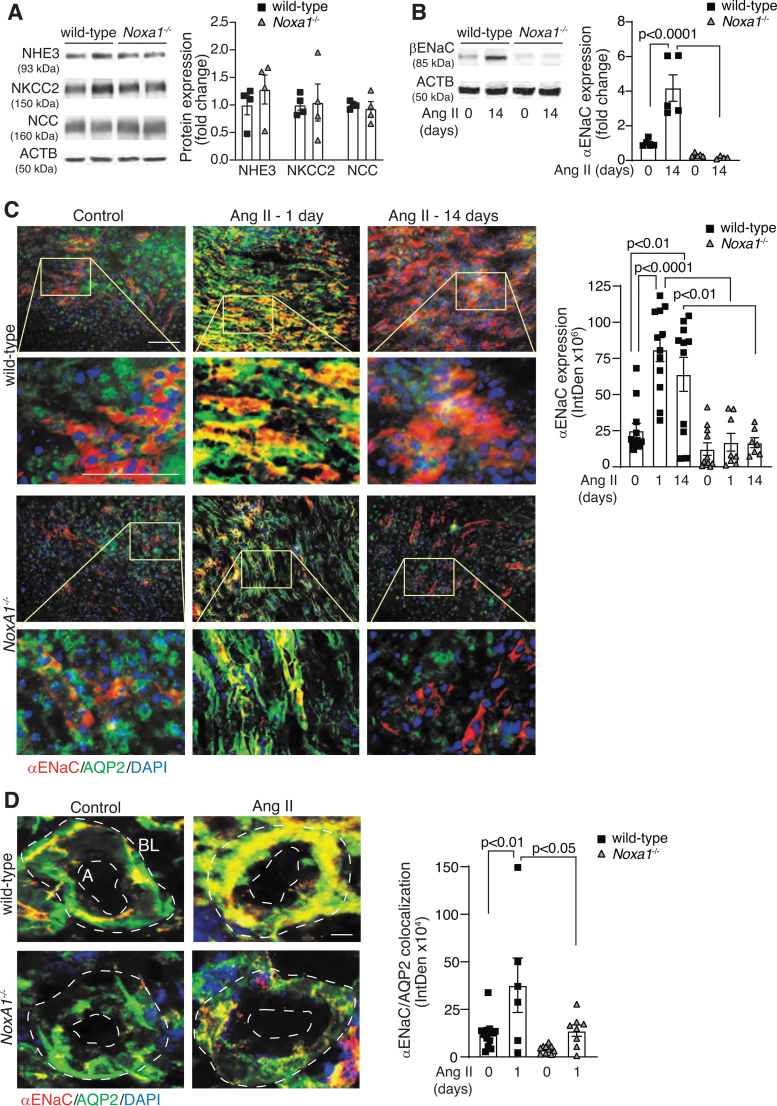
FIG. 5.
Renal expression of ENaC is increased in male wild-type mice treated with Ang II. (A) Western blot analysis and densitometry quantification of the sodium channels NHE3, NKCC2, and NCC expression in mice treated with Ang II for 14 days. Data are fold change in protein expression adjusted for ACTB levels and relative to wild-type (mean ± SEM). (B) Western blot analysis and densitometry quantification of βENaC levels in renal lysates from wild-type and Noxa1−/− mice treated with vehicle or Ang II for 14 days. Data are protein fold change adjusted for ACTB levels and relative to control (mean ± SEM). (C) Representative immunofluorescence images and quantification of αENaC expression in the renal sections from wild-type and Noxa1−/− mice treated with vehicle or Ang II for 1 or 14 days, and stained for αENaC (red), AQP2 (green), and DAPI (blue). High magnification insets (yellow rectangle) show αENaC expression in CD epithelial cell. Scale is 100 μm. Data are fluorescence integrated density (mean ± SEM). (D) Representative immunofluorescence images and quantification of αENaC colocalization with AQP2 on the apical (A) or basolateral (BL) side of the CD cells from wild-type and Noxa1−/− mice treated with vehicle or Ang II for 1 day, and stained for αENaC (red), AQP2 (green), and DAPI (blue). Data are fluorescence integrated density (mean ± SEM). Scale is 10 μm. ACTB, β-actin; ENaC, epithelial Na+ channel; NCC, Na-Cl cotransporter; NHE3, Na-H exchanger 3.

