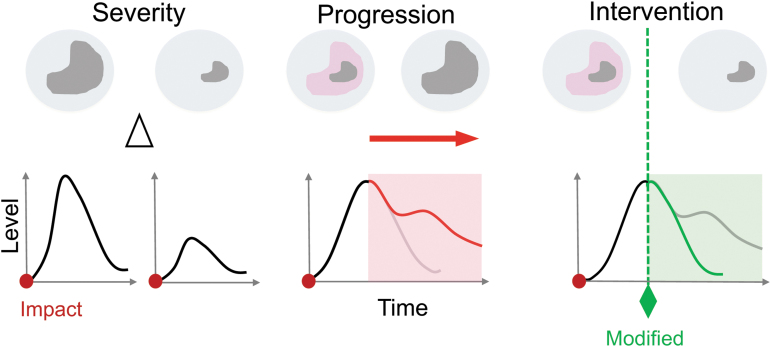
FIG. 1.
Profiling traumatic brain injuries (TBIs) with a corresponding biomarker response. The schematic depicts three different brain injury states (top) that associate with typical fluid biomarker profiles (bottom) to assess patient status/trajectories or specific pathophysiological processes after the onset of injury (red dot). (1) Severity: a severe (top left) or mild (top right) brain injury might lead to a lesion (gray). An accompanying biomarker profile (bottom) should strongly correlate with differences (delta) in the severity of the injury, with higher elevations of a biomarker expressed as the severity of injury increases. (2) Progression: acute TBIs cause primary injuries that result in irreversible neurodegeneration (gray). Over time (hours to weeks) the primary injury triggers progressive secondary biochemical cascades in perilesional, compromising tissue areas (pink). Biomarker trajectories profile the temporal injury progression with an increase in release after the primary injury (initial peak; black line) and secondary injury profiles that correlate with injury progression (red line). (3) Intervention: biomarker trajectories should profile treatment interventions. A treatment intervention at any time (dotted green line) may ameliorate injury progression and reduce secondary injury. The biomarker trajectory may subside (green line) in response to the treatment. Color image is available online.

