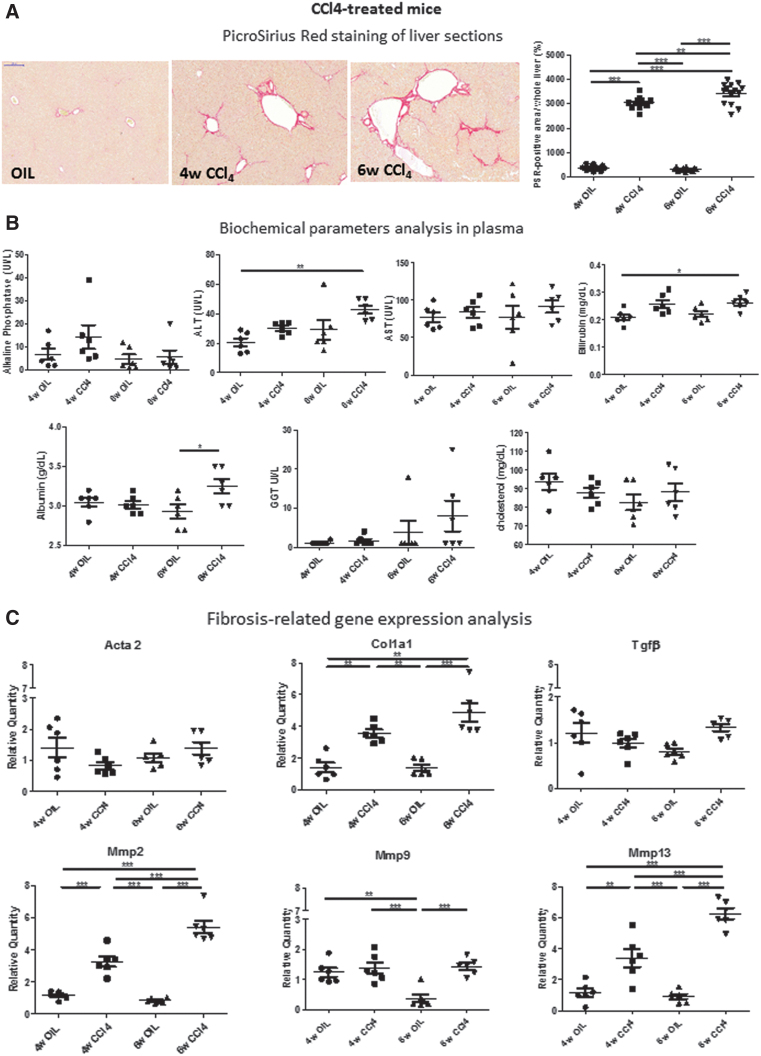
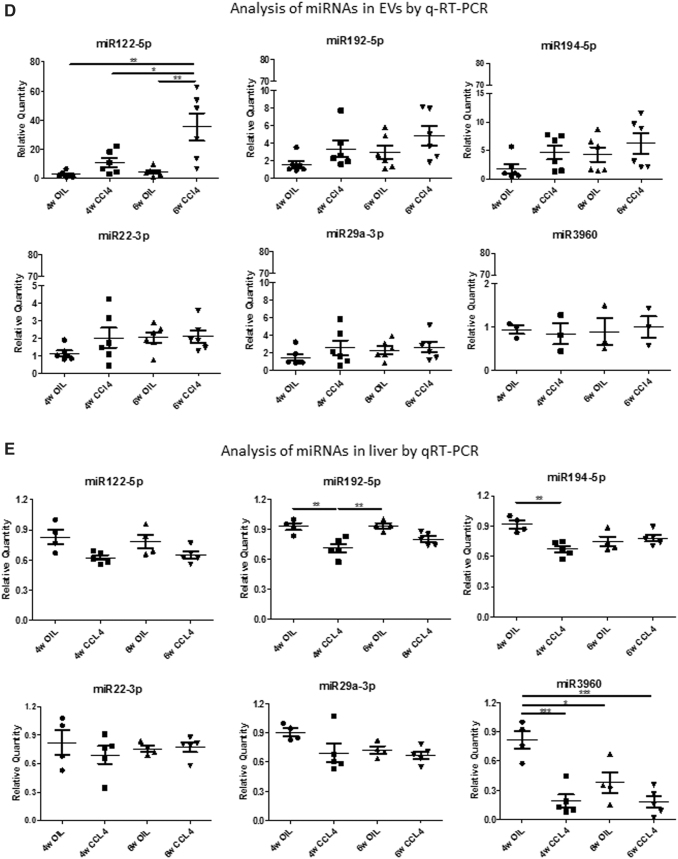
FIG. 9.
Analysis of CCl4-treated, non-cholestatic mice. (A) Collagen deposits (red) were analyzed by PSR staining in the livers of mice treated with CCl4 for 4 and 6 weeks with respect to vehicle-treated mice (OIL) (n = 14). (B) Biochemical parameters analysis (n = 6). (C) Fibrosis-related gene expression analysis (n = 6). (D) miRNAs identified as enriched in circulating by RNA-seq in the BDL model were analyzed by qRT-PCR. Data show mean ± SEM of abundance of each miRNA in circulating EVs (n ≥ 4). (E) Data show mean ± SEM of abundance of each miRNA in the liver of CCl4-treated mice by qRT-PCR (n = 3). *p < 0.05, **p < 0.01, ***p < 0.001. OIL, corn oil. Color images are available online.


