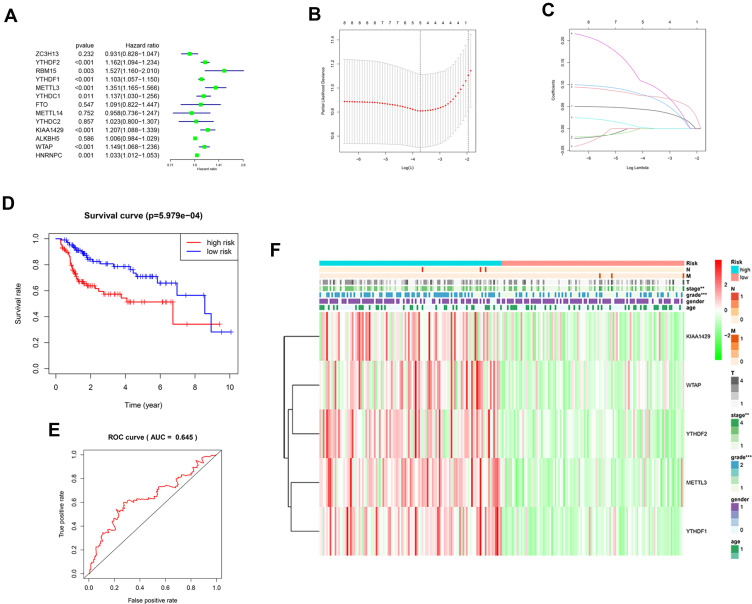
Figure 3.
(A) Forest plot of the univariate Cox regression analysis in the m6A related genes. (B and C) LASSO regression was performed, calculating the minimum criteria. (D) Kaplan–Meier analysis of the high-risk and low-risk group in the TCGA cohort. (E) The ROC curves of the risk score in the TCGA cohort. (F) The heatmap shows the expression levels of the five m6A related genes in the low-risk and high-risk group. The distribution of clinical features was compared between the low-risk and high-risk group. “**” represents statistical significance at p < 0.01, “***” represents statistical significance at p < 0.001.

