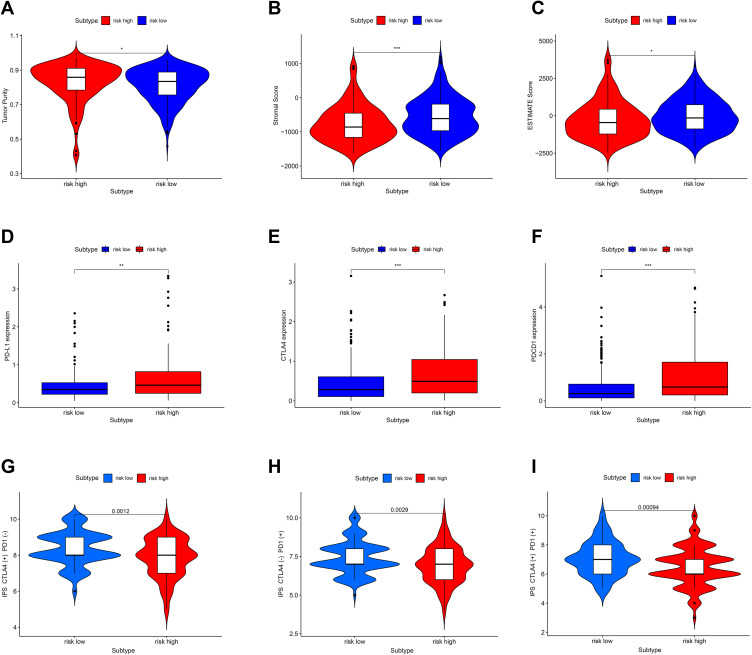
Figure 8.
Correlation between immunotherapy-related genes expression, tumor immune score, immunotherapy responsiveness, and risk score. (A–C) The Immune score in the high-risk and low-risk group. (D–F) The PD-L1 (CD724), CTLA-4, PDCD1 expression in the high-risk and low-risk group. (G–I) The potential effect of anti-CTLA4, anti-PD-1, and a combination of two drugs in the high-risk and low-risk group. “*” represents statistical significance at p < 0.05, “**” represents statistical significance at p < 0.01, and “***” represents statistical significance at p < 0.001.

