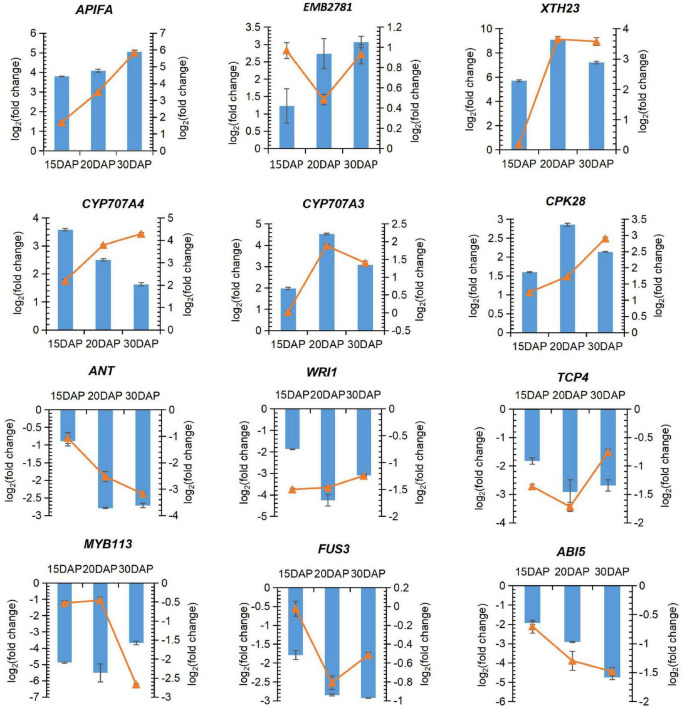
FIGURE 6.
Quantitative RT-PCR validation of selected DEGs under calcium deficiency and sufficiency in peanut embryo at 15, 20 and 30 DAP. Blue bar represents relative expression level changes calculated by the FPKM using RNA-seq. Orange line with indicates relative expression level changes determined by qRT-PCR analysis.

