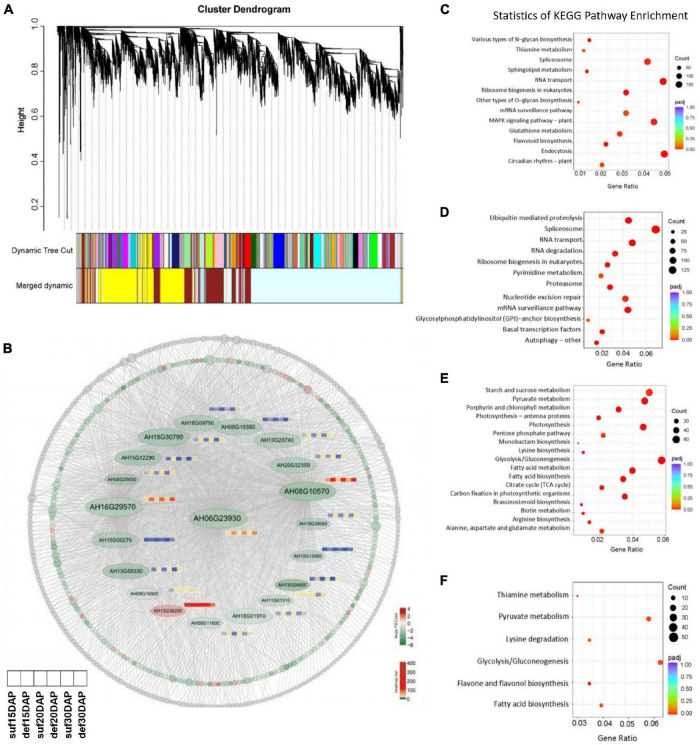
FIGURE 7.
WGCNA of the genes under calcium deficiency and sufficiency in peanut embryo at 15, 20 and 30 DAP. (A) Hierarchical clustering tree indicates 16 modules of co-expressed genes identified by WGCNA. (B) Network of the hub gene AhFUS3 (AH06G23930) and related genes with an edge weight of > 0.15 from the navajowhite2 module. Each circle represents one gene and red color indicates up-regulated genes, green indicates down-regulated genes, gray color represents the genes with no significant differences under calcium deficiency and sufficiency conditions. The expression profiles for important transcription factors in the navajowhite2 module under calcium deficiency and sufficiency conditions at the stage of 15, 20 and 30 DAP were analyzed. (C–F) KEGG analysis of genes in the darkolivegreen2, firebrick3, navajowhite, navajowhite2 modules.

