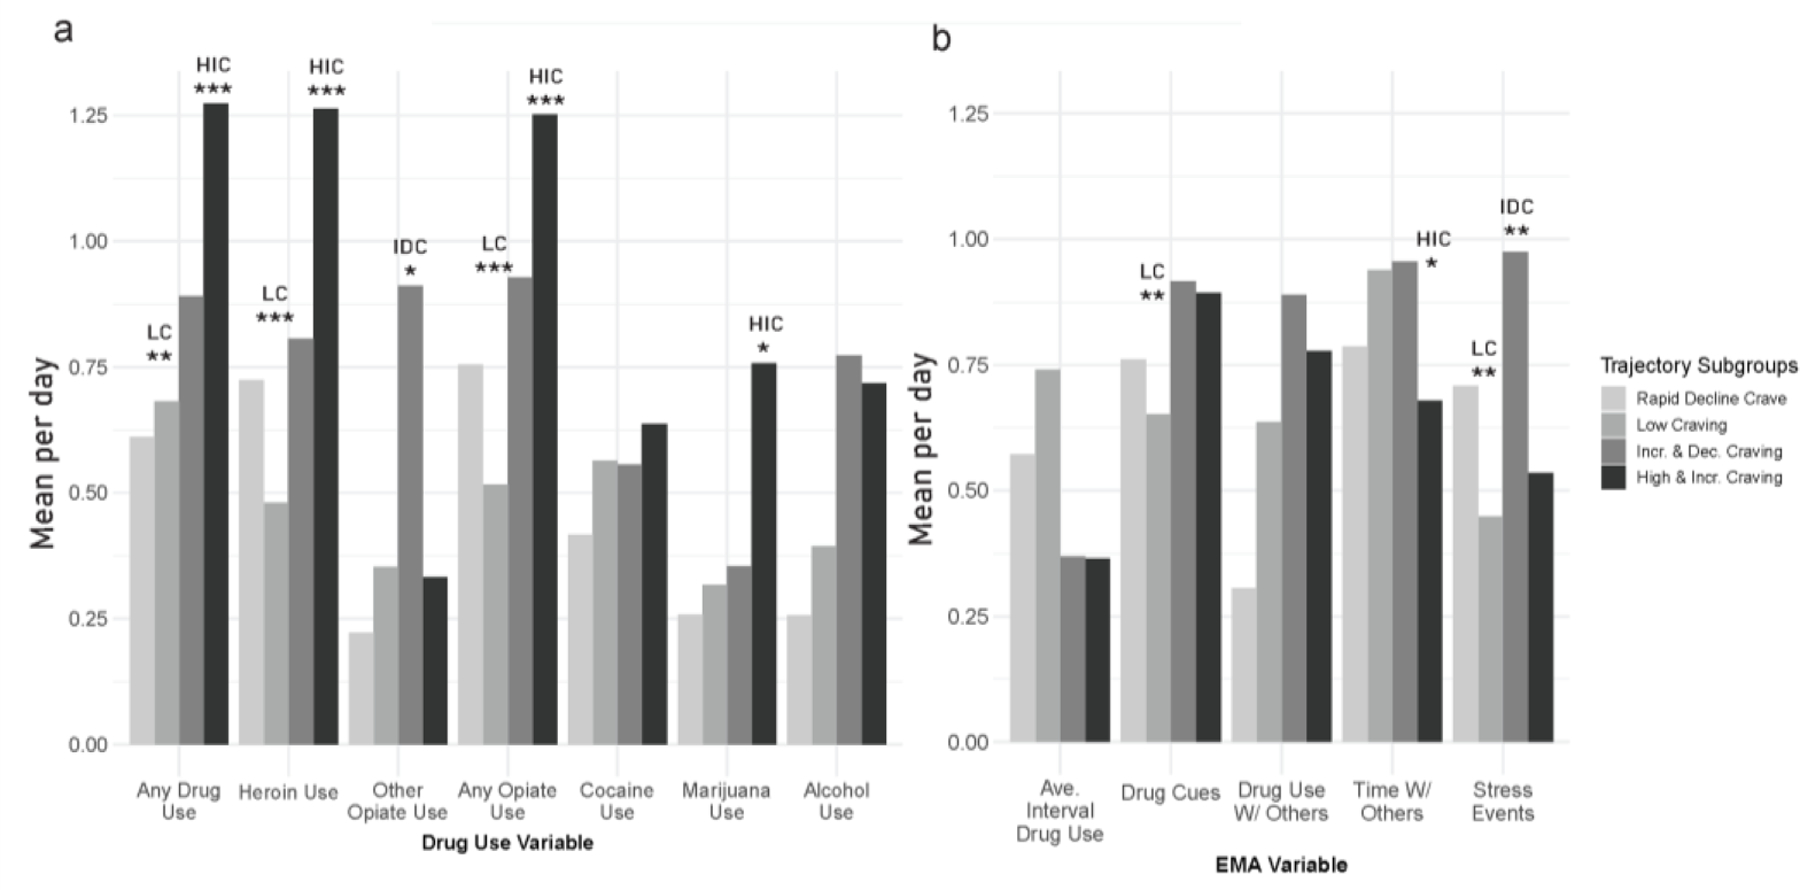
Figure 2.

Trajectory group differences for drug use (panel a) and average interval between drug use, cue exposure, social contact, and stress during treatment (panel b). All variables have been standardized by dividing by the root-mean square. Non-standardized values for each variable by trajectory subgroup are displayed in supplementary Table 3. HIC = High and Increasing Craving trajectory, LC = Low Craving trajectory. * = subgroup comparison (vs. all other subgroups) significant at p < 0.05, ** = subgroup comparison (vs. all other subgroups) significant at p < 0.01, *** = subgroup comparison (vs. all other subgroups) significant at p < 0.001.
