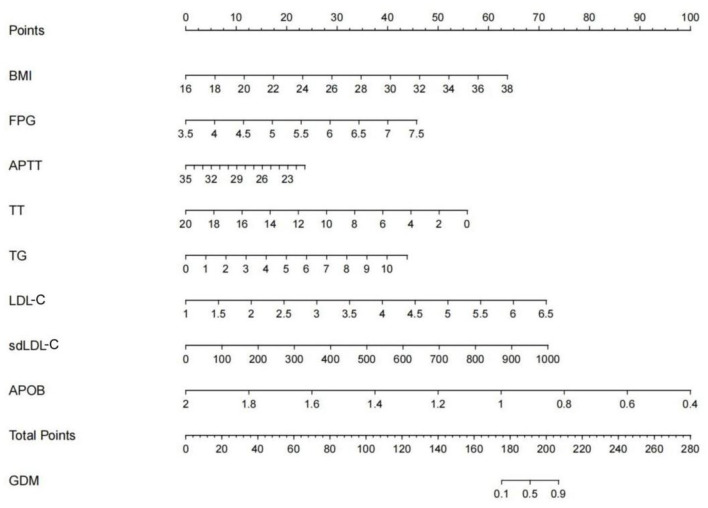
Figure 4.
The nomogram of predictive model for GDM. Patient prognostic values were located on the axis of each variable. A vertical line was then drawn from that value to the top points scale to determine the number of points for that particular variable. The sum of these numbers was located on the total score axis, and a line was drawn at a 90° angle downward to the GDM risk axis to determine the risk of GDM.

