. 2022 Apr 4;130(4):047001. doi: 10.1289/EHP10174

Figure 2.

Figure 2 is a clustered bar graph, plotting Proportion, ranging from 0.0 to 0.6 in increments of 0.09 (y-axis) across Relationship to cytosines followed by guanine residues island, including Island, Store, Shelf, and Open Sea, and Predicted Chromatin State, including Promoter, Enhancer, Insulator, Transcribed, Repressed, and Inactive (x-axis) for Glyphosate differentially methylated probes and other Probes on Array.

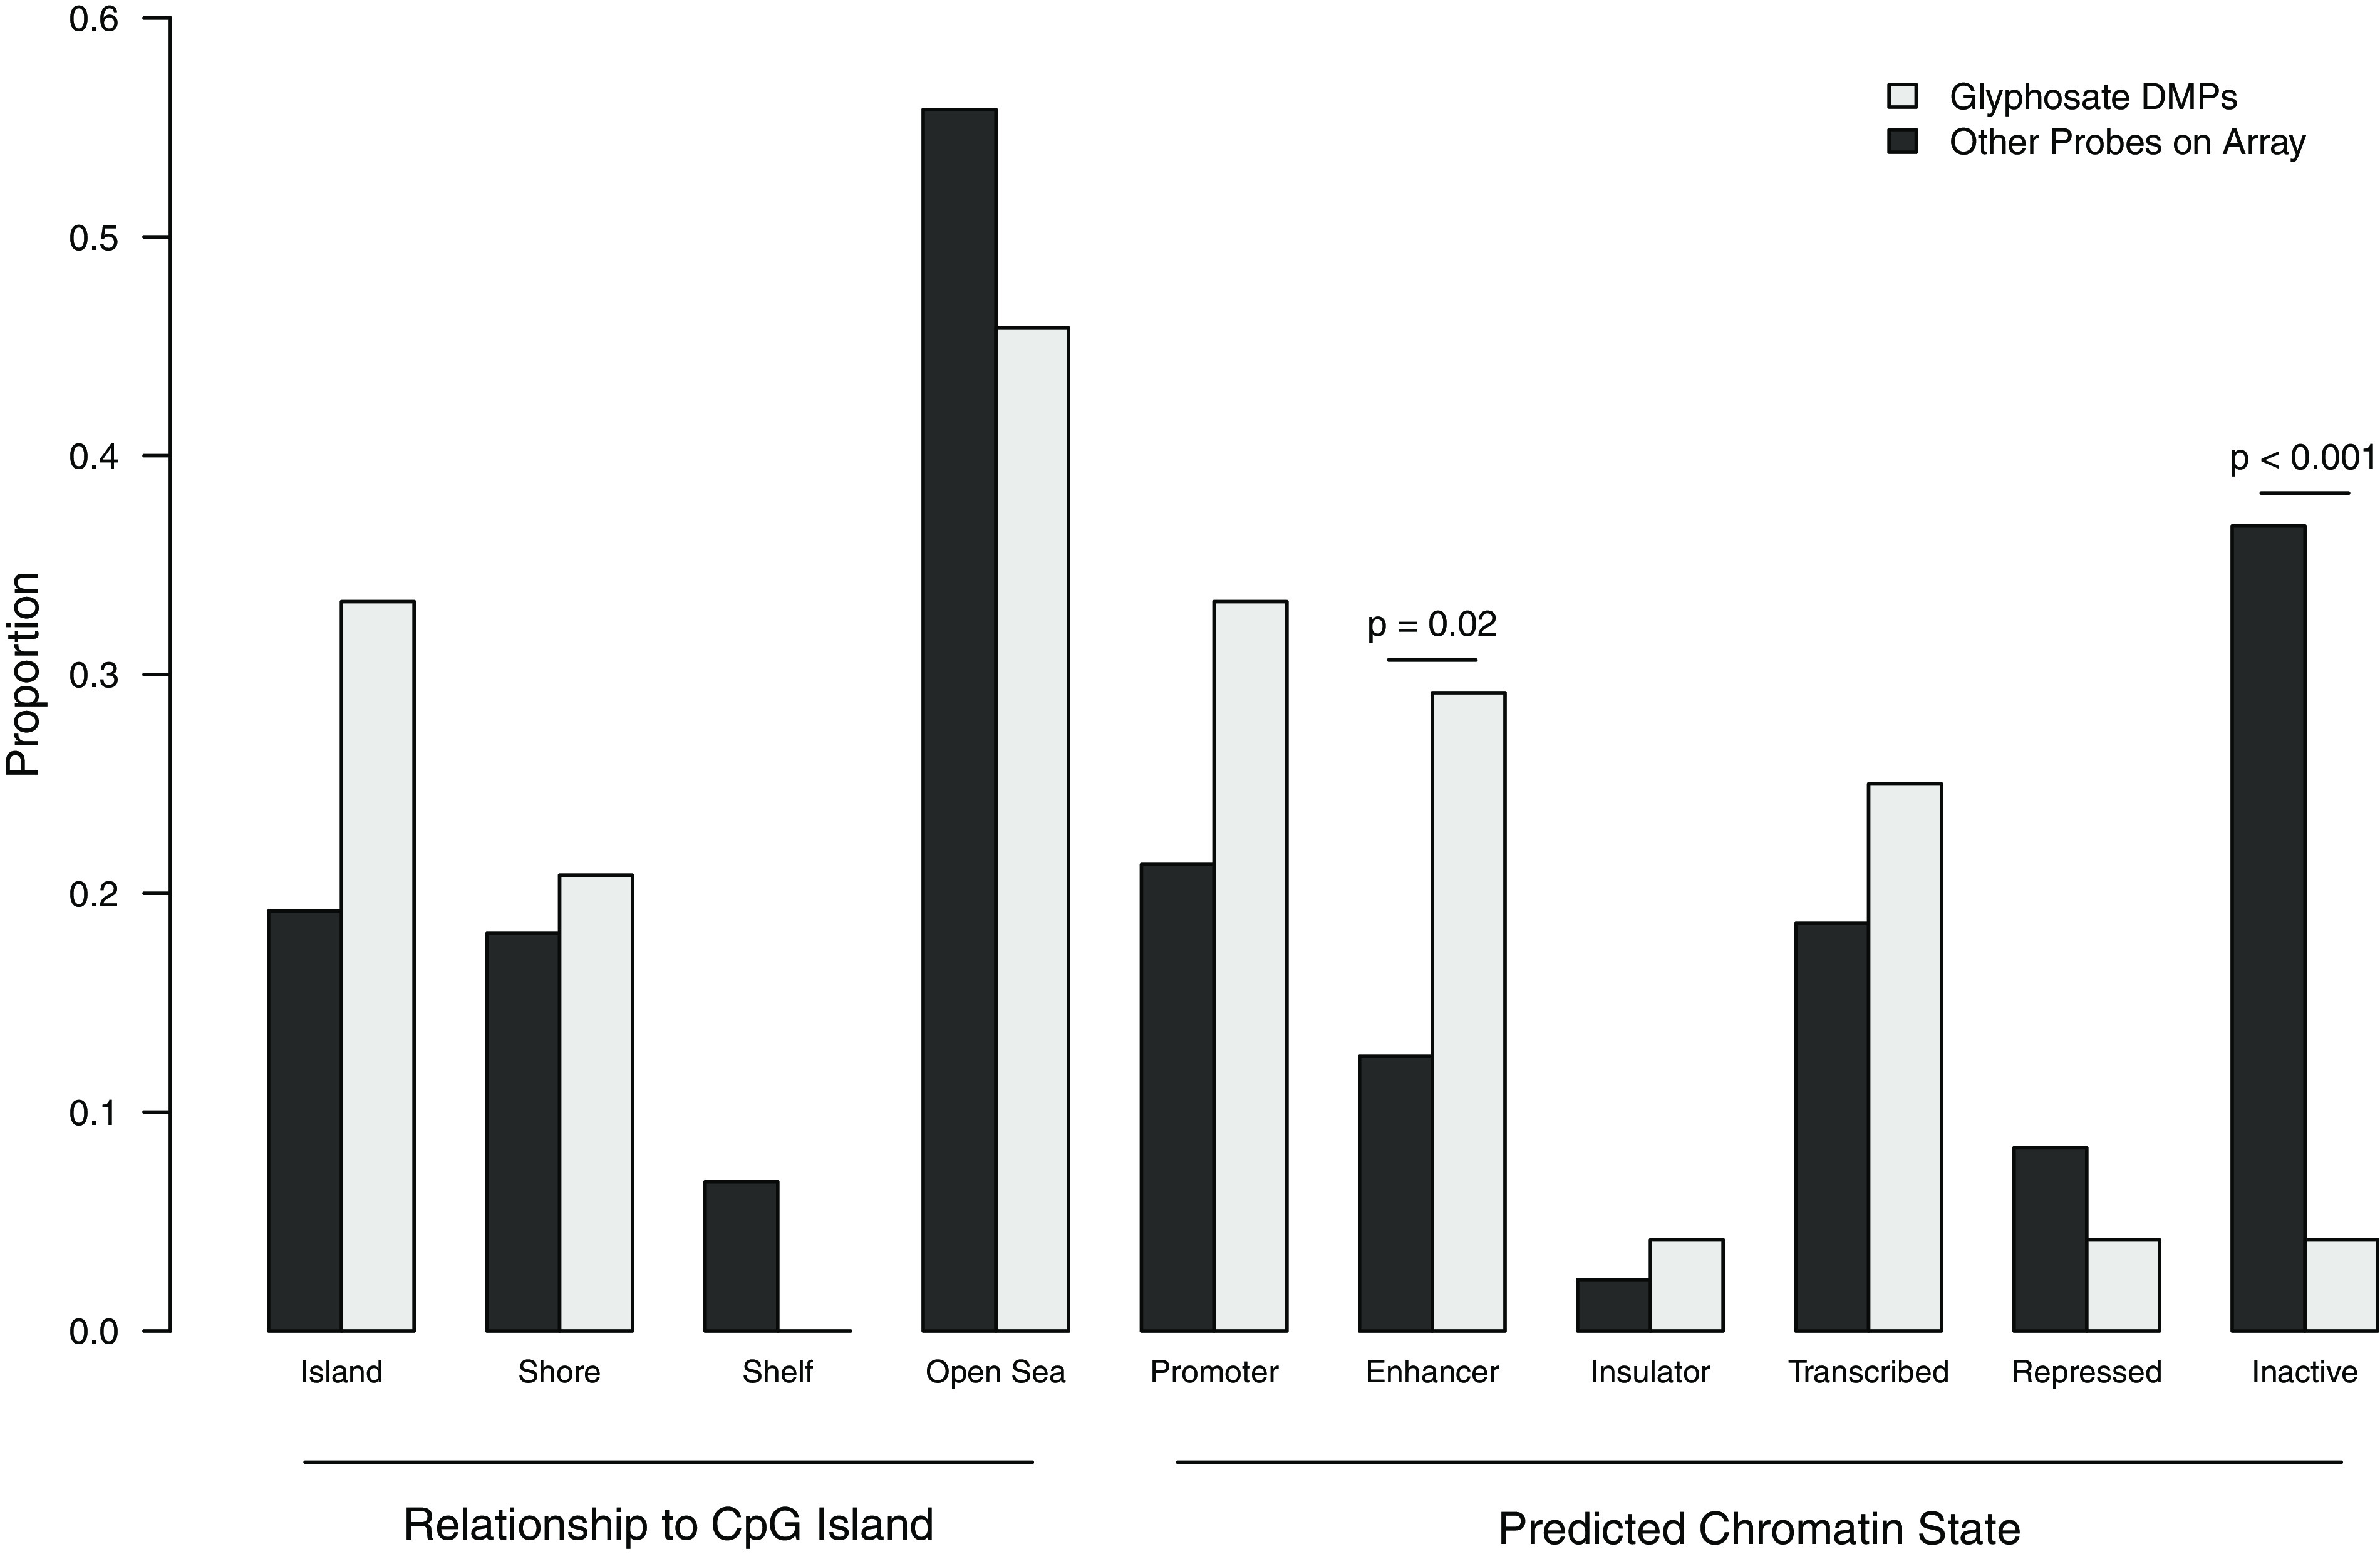
Enrichment analysis for genomic context of glyphosate-associated differentially methylated probes (DMPs) identified in 332 postmenopausal California women. The proportions of glyphosate-associated DMPs compared to other probes on the array in each genomic context were compared with Fisher’s exact test; significant (<0.05) p-values are labeled.