. 2022 Apr 4;130(4):047001. doi: 10.1289/EHP10174

Figure 3.

Figures 3A and 3B are dot graphs, plotting Predicted Glyphosate, nanogram per milliliter, ranging from 0.01 to 0.05 in increments of 0.04, 0.05 to 0.15 in increments of 0.1, 0.15 to 0.5 in increments of 0.35, and 0.5 to 1.5 in increments of 0.5 (y-axis) across actual Glyphosate, nanogram per milliliter, ranging from 0.01 to 0.05 in increments of 0.04, 0.05 to 0.15 in increments of 0.1, 0.15 to 0.5 in increments of 0.35, and 0.5 to 1.5 in increments of 0.5 (x-axis) for training set and validation set. Figure 3C is an error bar graph, plotting Methylation Index, ranging from negative 3.0 to negative 1.0 in increments of 0.5 (y-axis) across Glyphosate tertile, ranging from 1 to 3 in unit increments (x-axis) for Analysis of variance. Figure 3D is a line graph, plotting Sensitivity, ranging from 0.0 to 1.0 in increments of 0.2 (y-axis) across specificity, ranging from 1.0 to 0.0 in decrements of 0.2 (x-axis) for area under the curve.

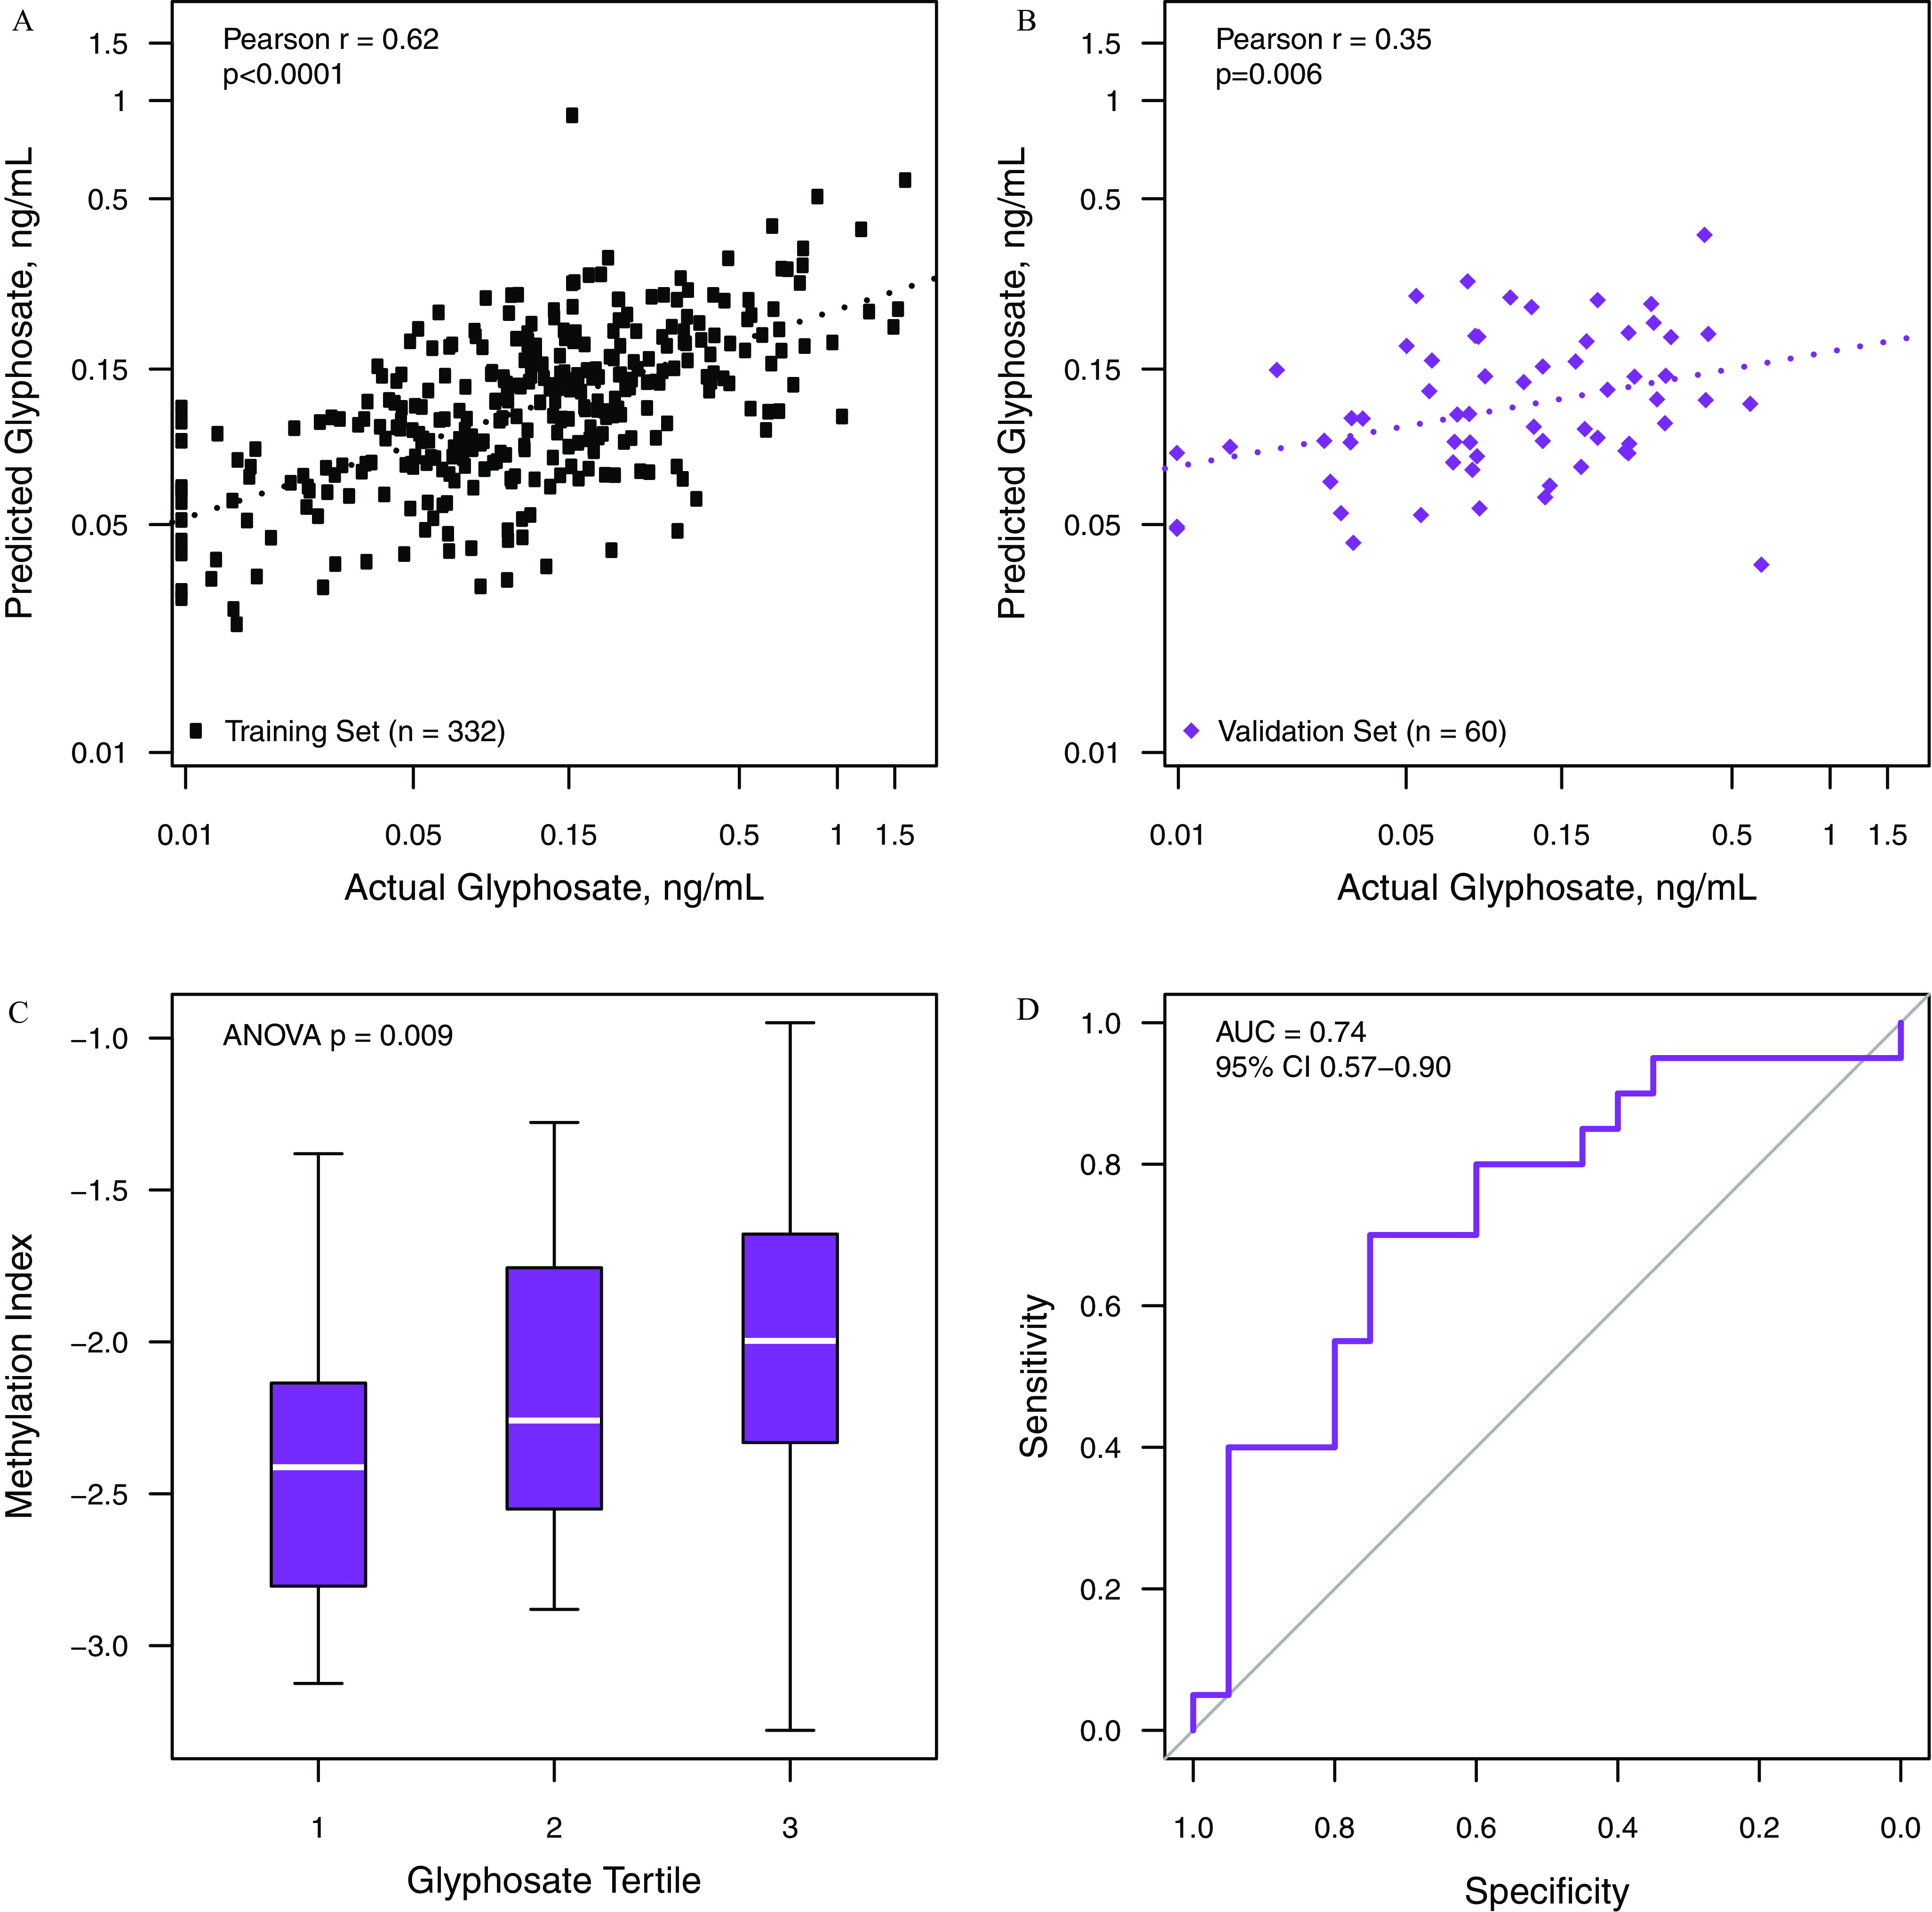
Performance of methylation index using 24 CpG sites to predict the natural logarithm of urinary glyphosate concentration in the training set (A) and the validation set (B, C). Panel C shows the methylation index was significantly associated with glyphosate tertile [median (IQR) 2.4 (2.7 to 2.2 for lowest tertile vs. 2.0 (2.3 to 1.6) for highest tertile, ANOVA p=0.009] in the validation set. Panel D shows the classification performance of the methylation index in the validation set for classifying the highest vs. the lowest tertile of urinary glyphosate. The index was developed using elastic net regression on methylation β values of differentially methylated probes associated with glyphosate in the training set, a population of 332 postmenopausal California women. Note: ANOVA, analysis of variance; IQR, interquartile range.