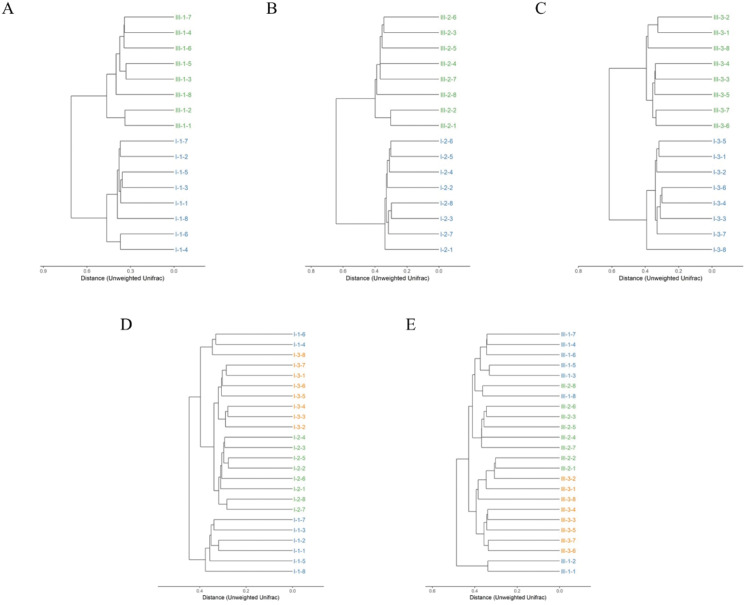
Figure 3. Hierarchical clustering of bacterial communities assessed using unweighted Unifrac metric analysis of OTUs between calves with and without dam.
On day 35 (A), 65 (B) and 95 (C) and on the three timepoints of feces in calves with and without dam (D and E) at 97% similarity. The scale bar shows approximate unweighted UniFrac metric similarity coefficient of 0.2 in the comparison between calves with and without dam and 0.3 in the three different timepoints. Con represented calves with dam and Trt represented calves without dam. The Roman numeral I means the calves with dam, and III means the calves without dam.

