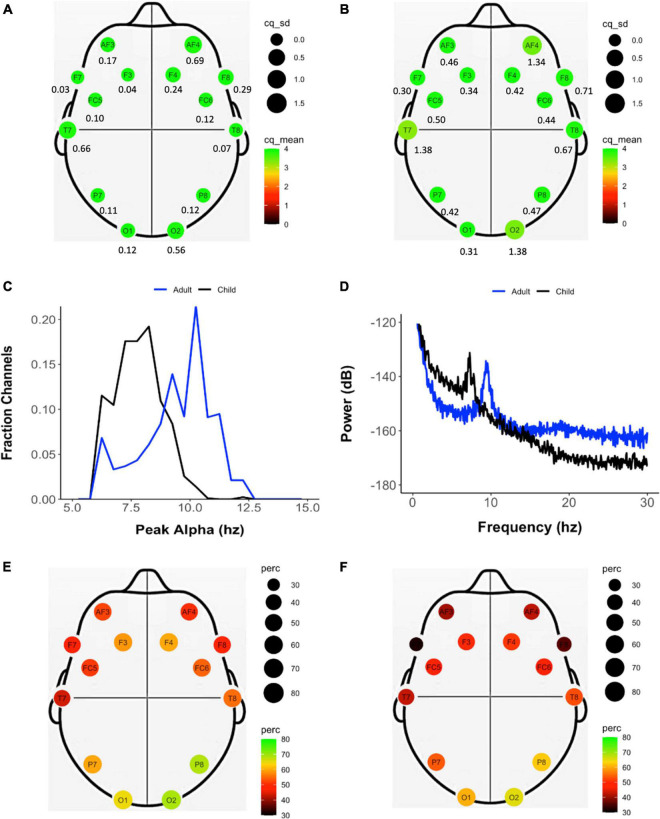
FIGURE 3.
Properties of the EEG data recorded during eyes-closed resting state across the study sample of adults and children. Mean (color and size coded) and standard deviation (reported below each electrode location) of the channel quality of each electrode in adults (A) and (B) children. (C) Frequency of peak alpha (Pa) calculated individually for each channel in adults (blue) and children (black). (D) Power spectrum derived from representative EEG recordings from adults (blue) and children (black). Frequency (color and size coded) of presence of an alpha peak at each electrode location in adults (E) and children (F).

