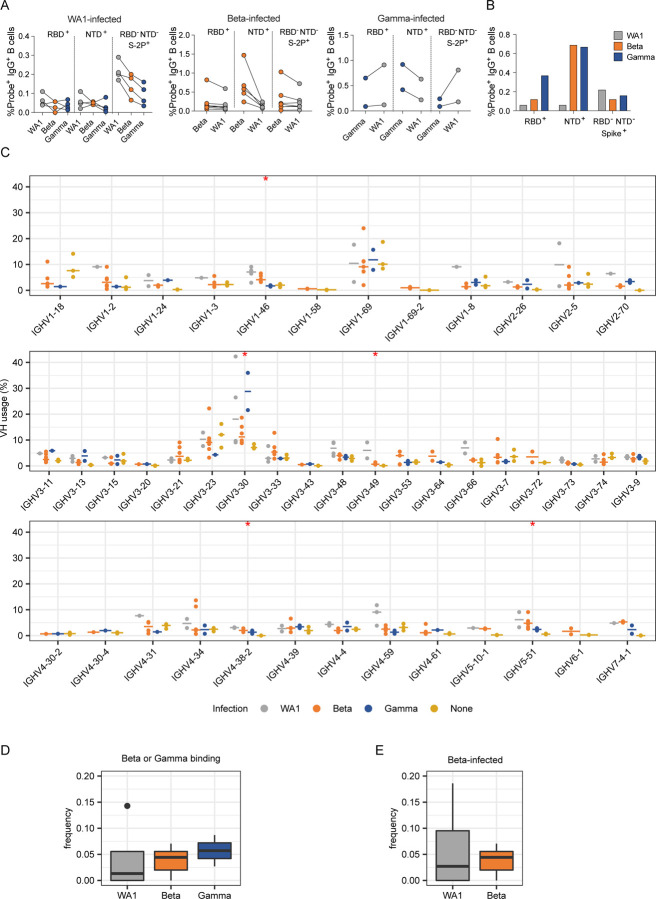
Fig. 3:
Anti-SARS-CoV-2 Ig repertoires. (A) Frequencies of probe+ B cells sorted for IG repertoire analysis. (B) Proportion of probe+ B cells binding to each domain. (C) SARS-CoV-2-specific VH repertoire analysis by infecting variant WA1, Beta and Gamma shown in grey, orange and blue, respectively, with data from pre-pandemic controls in yellow. X-axis shows all germline genes used; y-axis represents percent of individual gene usage. Stars indicate genes with at least one significant difference between groups; pairwise comparisons are in Extended Data Fig. 8. (D) and (E) Combined frequency of VH genes capable of giving rise to stereotypical Y501-dependent antibodies (IGHV4-30, IGHV4-31, IGHV4-39, and IGHV4-61) in (D) Beta- or Gamma-binding B cells from individuals infected with each variant or (E) B cells from Beta-infected individuals sorted with either WA1- or Beta-derived probes.

