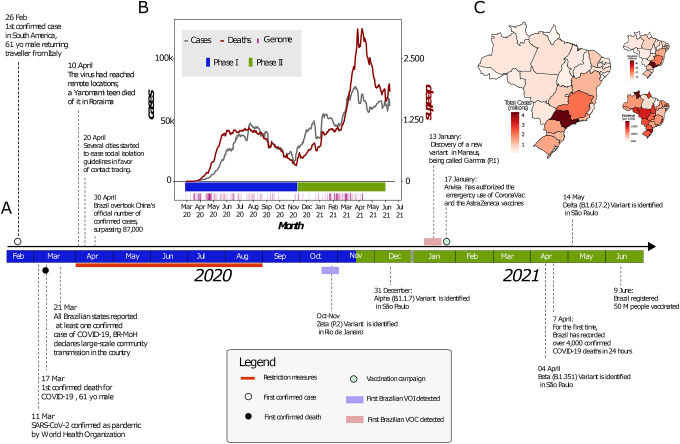
Fig. 1. Key events following the first confirmed infection of SARS-CoV-2 in Brazil.
(A) Timeline of SARS-CoV-2 key events in Brazil. The Brazilian map was colored according to geographical macro region: North (red), Northeast (green), Southeast (purple), Midwest (light blue) South (light orange). (B) Epidemic curve showing the progression of reported daily viral infection numbers in Brazil from the beginning of the epidemic (grey) and deaths (red) in the same period, with restriction phases indicated along the bottom. (C) Map of cumulative SARS-CoV-2 cases per 100,000 inhabitants in Brazil up to June 2021.

