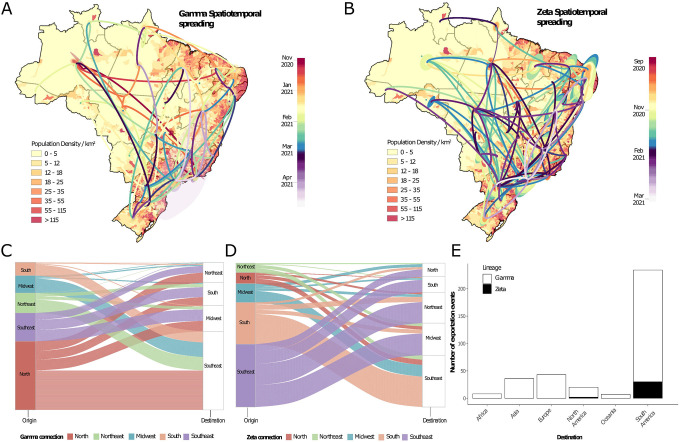
Fig. 3. Spatiotemporal spread of VOC and VUM in Brazil.
(A) Phylogeographic reconstruction of the spread of the Gamma VOC in Brazil. Circles represent nodes of the maximum clade credibility phylogeny and are colored according to their inferred time of occurrence. Shaded areas represent the 80% highest posterior density interval and depict the uncertainty of the phylogeographic estimates for each node. Differences in population density are shown on a dark-white scale; B) Phylogeographic reconstruction of the spread of the Zeta VUM across Brazil. Circles represent nodes of the maximum clade credibility phylogeny and are colored according to their inferred time of occurrence. Shaded areas represent the 80% highest posterior density interval and depict the uncertainty of the phylogeographic estimates for each node. Differences in population density are shown on a dark-white scale; In both Panels (A) and (B) solid curved lines denote the links between nodes and the directionality of movement is anti-clockwise along the curve (as shown in the “dispersal direction” sublegends). (C) Number of exchanges of the Gamma variant between Brazilian regions (N=North; NE=Northeast; MD=Midwest; SE=Southeast; S=South); (D) Number of exchanges of the Zeta variant between Brazilian regions; (E) Sources of viral export of the VOC and VUM from Brazil to the rest of the world.

