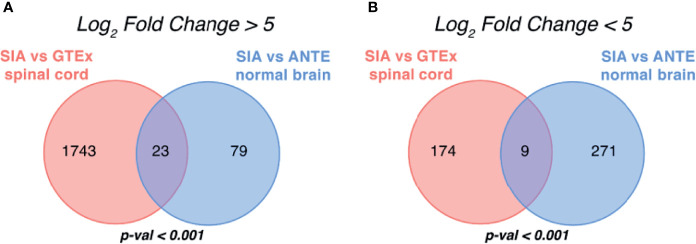
Figure 3.
Intersection of differentially expressed gene sets between spinal intramedullary astrocytomas (SIAs), GTEx healthy spinal cord, and ANTE healthy brain samples. Intersections of (A) upregulated and (B) downregulated differentially expressed gene sets between SIA–GTEx spinal cord and SIA–ANTE normal brain samples are shown; p-values for intersection significance obtained in perturbation test are highlighted in bold.

