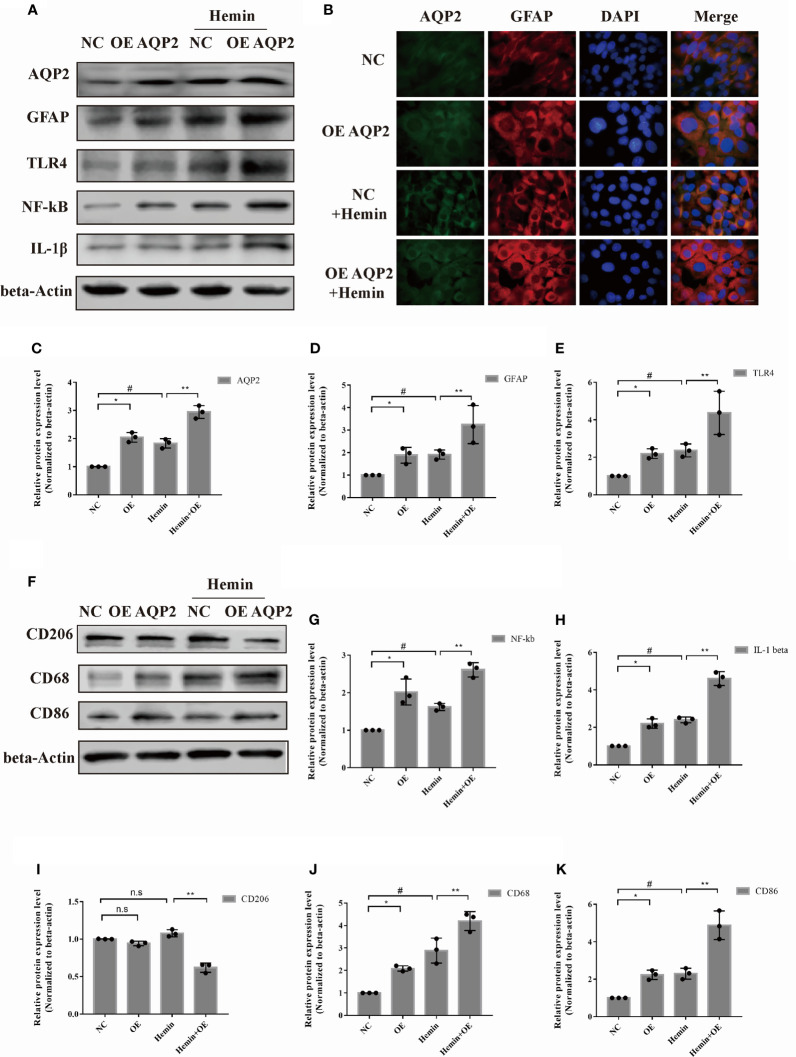
Figure 4.
AQP2 overexpression directly increases astrocyte activation and indirectly promotes microglia migration. (A) Astrocyte were transfected with pcDNA3.1 empty vector or pcDNA3.1-AQP2 plasmid, and AQP2, GFAP, TLR4, NF-kB and IL-1β were assessed by western blotting (n = 3/group). (B) Immunofluorescence of AQP2 (red signal) and GFAP (green signal) in astrocyte with AQP2 overexpression or negative control (empty vector). Astrocyte cell nuclei were immunostained (blue, DAPI). Scale bar: 10 μm. (C, D) and (G, H) Quantification of the relative protein expression levels of AQP2, GFAP, TLR4, NF-kB and IL-1β. (*p < 0.05 vs. empty vector group; **p < 0.05 vs. empty vector group exposed to hemin; #p < 0.05 empty vector group vs. empty vector group exposed to hemin). The data are presented as the mean ± s.d. of three independent experiments. (F) Microglia were treated with medium of astrocyte for 24h transfected with pcDNA3.1 empty vector or pcDNA3.1-AQP2 plasmid (with or without hemin). CD206, CD68 and CD86 were assessed by western blotting (n = 3/group). Quantification of the relative protein expression level of CD206 (I), CD68 (J) and CD86 (K) is shown. (*p < 0.05 vs. empty vector group; **p < 0.05 vs. empty vector group exposed to hemin; #p < 0.05 empty vector group vs. empty vector group exposed to hemin). The data are presented as the mean ± s.d. of three independent experiments.

