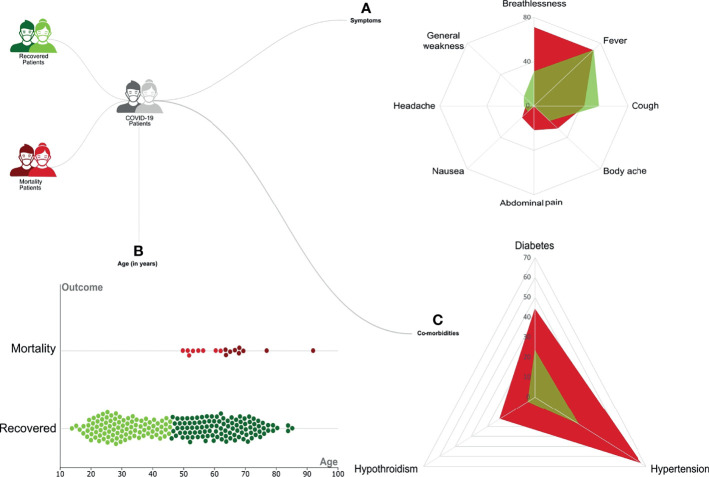
Figure 2.
Representation of the clinical demographics of the coronavirus disease 2019 (COVID-19) patients. A total of 246 COVID-19 patients were divided into 228 Recovered (in green) and 18 Mortality (in red). The categorical clinical features presented by the patients are as follows: (A) Differential presence of various symptoms like breathlessness, fever, cough, body ache, nausea, headache, and general weakness between the Recovered (in green) and Mortality (in red). (B) The age of patients in the two groups is represented as a violin plot where the darker color represents the upper quartile range. (C) Differential presence of comorbidities like diabetes, hypertension, and hypothyroidism between the Recovered (in green) and Mortality (in red).

