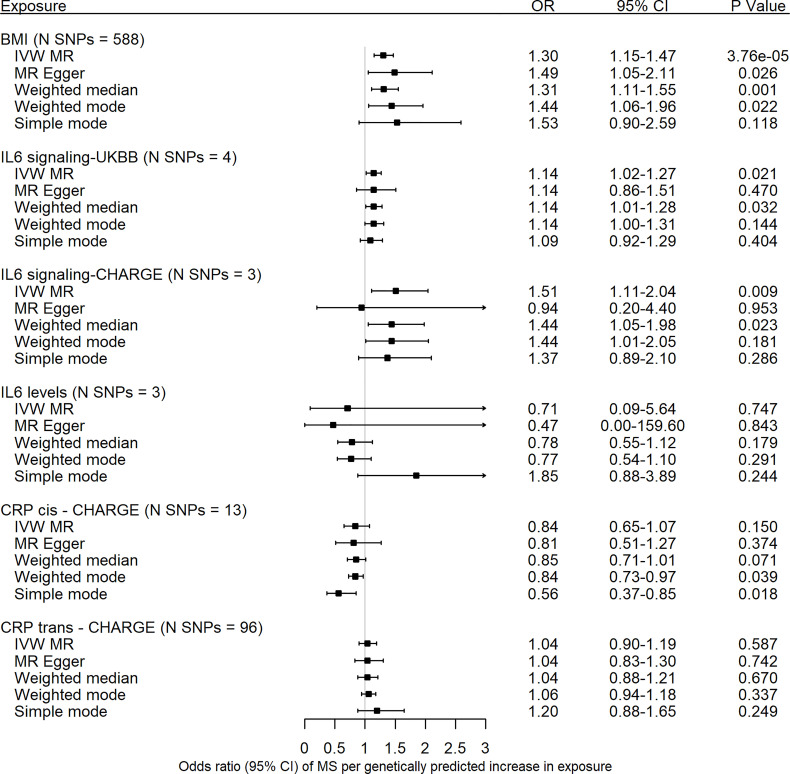
Figure 2.
Forest plot of univariable Mendelian randomization estimates of body mass index, interleukin-6 signaling, interleukin-6 levels and c-reactive protein with risk of multiple sclerosis. Data are displayed as odds ratio (OR) and 95% confidence interval (CI) per SD increase in genetically predicted BMI levels, per unit increase in c-reactive protein (CRP) levels for interleukin-6 (IL-6) signaling UKBB, per unit increase in natural-log transformed CRP levels for IL-6 signaling CHARGE and CRP CHARGE, and per unit increase in natural-log transformed IL-6 levels for IL-6 levels CHARGE. UKBB, UK Biobank; CHARGE, Cohorts for Heart and Aging Research in Genomic Epidemiology; CRP, c-reactive protein; MR, Mendelian randomization; N SNPs, number of variants in the analysis; SNP, single nucleotide polymorphisms; IVW, inverse-variance weighted method.

