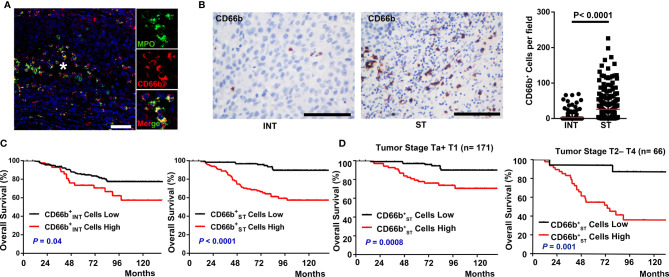
Figure 1.
Spatial distribution of neutrophils and prognostic significance of their density with overall survival in UCB patients. (A) Paraffin-embedded UCB sections were subjected to two-color immunofluorescence staining for CD66b (red) and MPO (green). * marked the magnified field. Scale bar: 20 μm. (B) Distribution of CD66b+ in the intratumoral (INT) and stromal (ST) regions of UCB tissues (n = 237). Scale bar: 100 μm. Cell numbers were calculated as the cell count per 400× field. Data are expressed as the means ± SEM. (C) Cumulative overall survival curves of the patients. Patients were divided into two groups according to the median number of CD66b+ cells per 400× fields, including cells in INT regions ( cells, median = 0 cell/field), CD66b+ cells in ST regions ( cells, median = 5 cell/field). (D) Kaplan-Meier overall survival curves stratified by tumor stage. NMIBC (non-muscle-invasive bladder cancer, tumor stage Ta+T1, n = 171) and MIBC (muscle-invasive bladder cancer, tumor stage T2-T4, n = 66); Kaplan-Meier survival estimates and log-rank tests were used to analyze the prognostic significance of these cells. Black lines, low group; red lines, high group.

