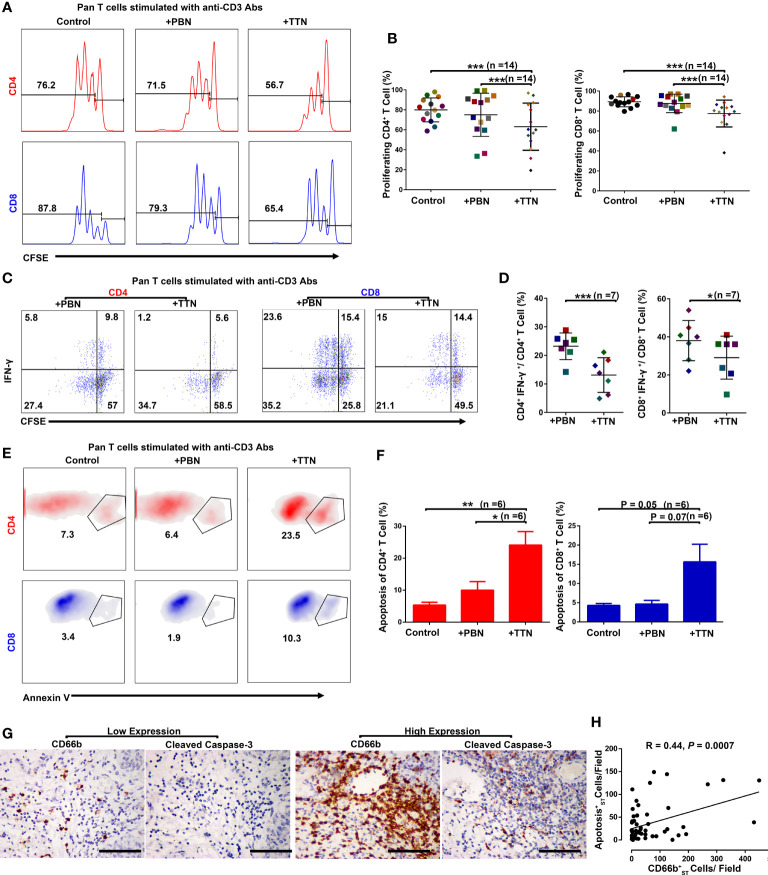
Figure 3.
T cell proliferation, apoptosis, and activation in the presence of PBNs or TTNs. In all experiments, autologous T cells were purified from PBMCs, stimulated with plate-bound anti-CD3/CD28 Abs, and were cultured alone or with PBNs or the tumor cell line T24 supernatant-treated PBNs (TTNs) at a 1:1 ratio for five days. (A, B) Flow cytometric analysis of autologous CD4+ T cells and CD8+ T cells proliferation in the presence of PBNs or TTNs (n = 14). (C, D) Flow cytometric analysis of autologous CD4+ T cells and CD8+ T cells IFN-γ production in the presence of PBNs or TTNs (n = 7). (E, F) Flow cytometric analysis of autologous CD4+ T cells and CD8+ T cells apoptosis in the presence of PBNs or TTNs (n = 6). Numbers on histograms or a density plot represented the percentage of T cell proliferation or apoptosis, respectively (A, E). Numbers in quadrants indicate the percentage of cells in each quadrant (C). Error bars represent the mean ± SEM. P < 0.05 was considered a significant difference (Student’s t-test, paired parametric test). (G, H) Consecutive sections were used for the immunohistochemical identification of stromal CD66b+ cells and apoptosis makers (Cleaved Caspase-3) in UCB tissues (n= 57). P < 0.05 was considered significant difference (Spearman’s rank correlation coefficient test). Representative examples of tumors with either low (top) or high (bottom) expression of neutrophil (CD66b), apoptosis (Cleaved Caspase-3) markers are shown. Scale bar: 100 μm. * P < 0.05; ** P < 0.001; *** P < 0.0001.

