Figure 4.
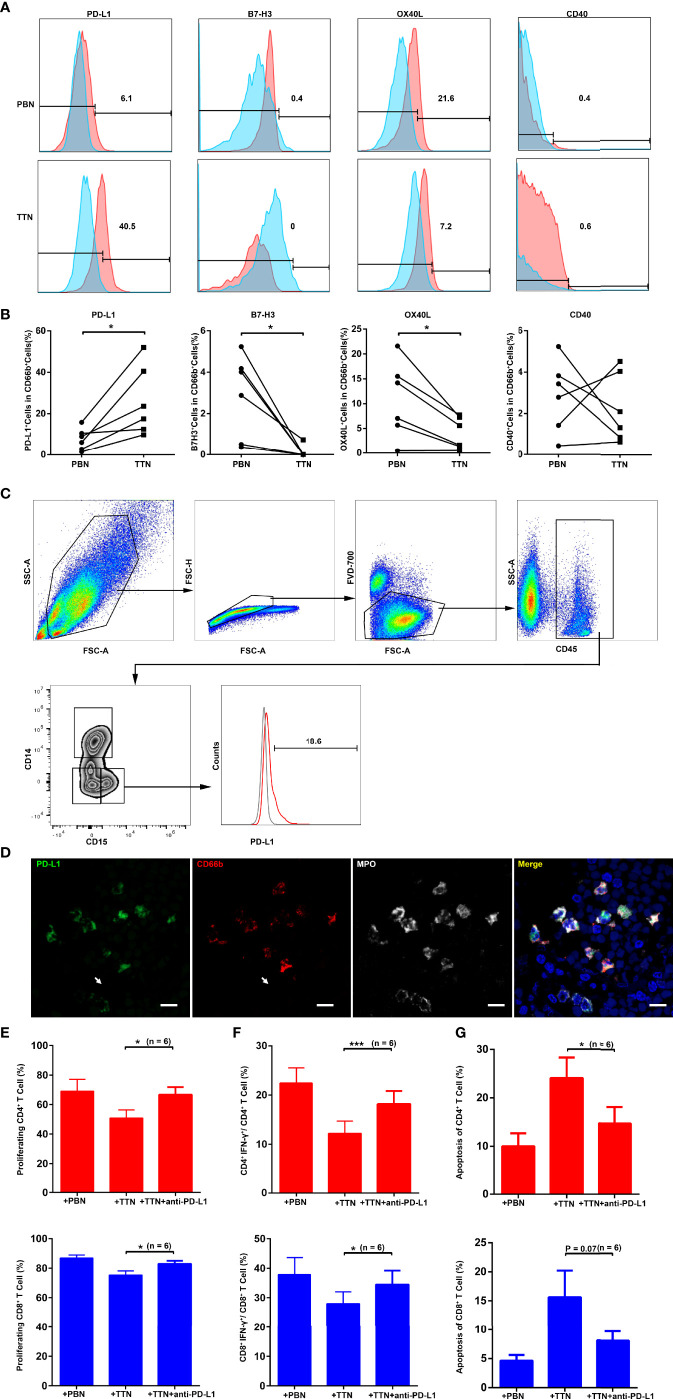
The expression of PD-L1 on TTN and its role in the suppression of T cell immunity. (A) The expression of co-suppressive molecules (PD-L1 and B7-H3) and co-stimulatory molecules (OX40L and CD40) were analyzed by flow cytometry on gated live CD11b+CD66b+ PBNs (top) and tumor cell line T24 supernatant-treated PBNs (TTNs, bottom). Results from one out of six representative experiments are shown. (B) The panel summarizes the change in the percentage of the indicated markers on autologous PBNs and TTNs. (C) The expression of PD-L1 were analyzed by flow cytometry on gated CD45+CD15+ TANs in human fresh UCB tissues. (Gray: Isotype; Red: TANs). (D) Representative pictures showing the co-expression of PD-L1 with CD66b and MPO on tumor-infiltrating neutrophils in UCB tissues. (E–G) The efficacy of a PD-L1 blocking Ab in ablating the effect of TTNs on T cell proliferation (E), IFN-γ production (F) and apoptosis (G). Data shown are from six independent experiments in E–G, respectively. Error bars represent the mean ± SEM. P < 0.05 was considered a significant difference (Student’s t-test, paired parametric test). * P < 0.05; *** P < 0.0001.

