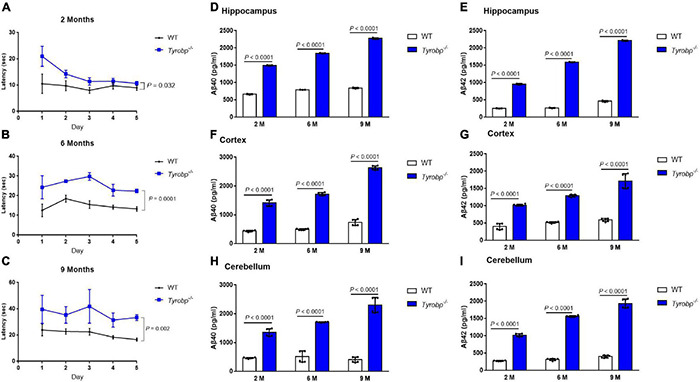
FIGURE 2.

Performance in the Morris water maze and levels of soluble Aβ40 and Aβ42 in WT and Tyrobp–/– mice. (A–C) Escape latency of WT and Tyrobp–/– mice aged 2, 6, or 9 months. (D,E) Levels of soluble Aβ40 and Aβ42 in hippocampus of WT and Tyrobp–/– mice aged 2, 6, or 9 months (M), as detected by ELISA. (F,G) Levels of soluble Aβ40 and Aβ42 in cortex of WT and Tyrobp–/– mice aged 2, 6, or 9 months (M), as detected by ELISA. (H,I) Levels of soluble Aβ40 and Aβ42 in cerebellum of WT and Tyrobp–/– mice aged 2, 6, or 9 months (M), as detected by ELISA. Data are mean ± SEM (six mice per group). Differences were assessed for significance using two-way ANOVA for repeated measures, followed by Tukey’s post hoc test.
