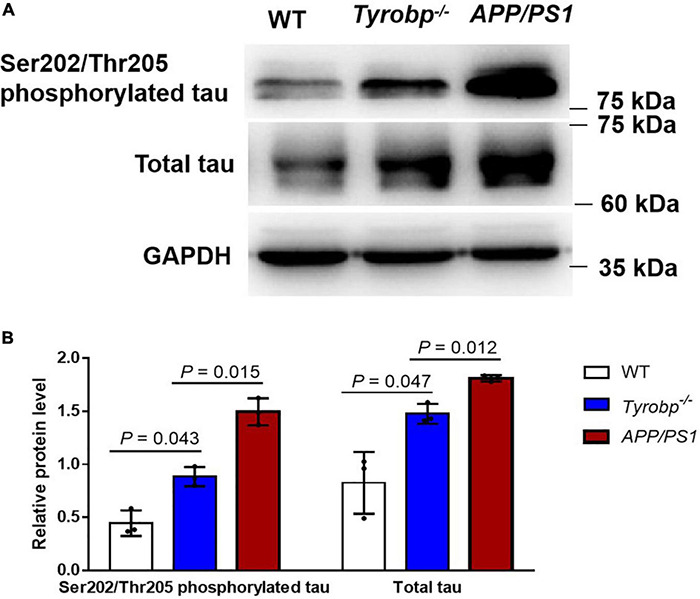
FIGURE 4.

Levels of total tau and Ser202/Thr205-phosphorylated tau in WT, Tyrobp–/– and APP/PS1 mice. (A) Western blot analysis. (B) Quantification of total tau and Ser202/Thr205-phosphorylated tau. Data are mean ± SEM from three independent experiments (three mice per group). Differences were assessed for significance using Student’s t test.
