FIGURE 6.

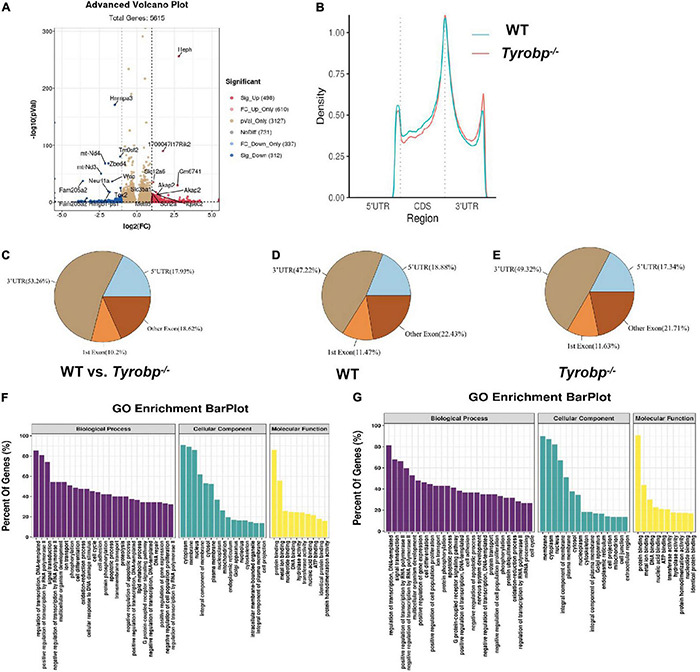
Characteristics of m6A methylation in the hippocampus of 6-month-old Tyrobp–/– mice. (A) Volcano plots showing m6A peaks differing significantly between Tyrobp–/– and wild-type (WT) mice. (B) Average distribution of m6A peaks along transcripts in the hippocampus. (C–E) Pie charts showing the distribution of m6A peaks. (F) Major Gene Ontology terms for transcripts whose m6A methylation was upregulated in Tyrobp–/– mice. (G) Major Gene Ontology terms for transcripts whose m6A methylation was downregulated in Tyrobp–/– mice. Up- or downregulation was defined, respectively, as fold change ≥ 2 or fold change ≤ –2 combined with P < 0.05. Nine mice were used in each group.
