FIGURE 8.

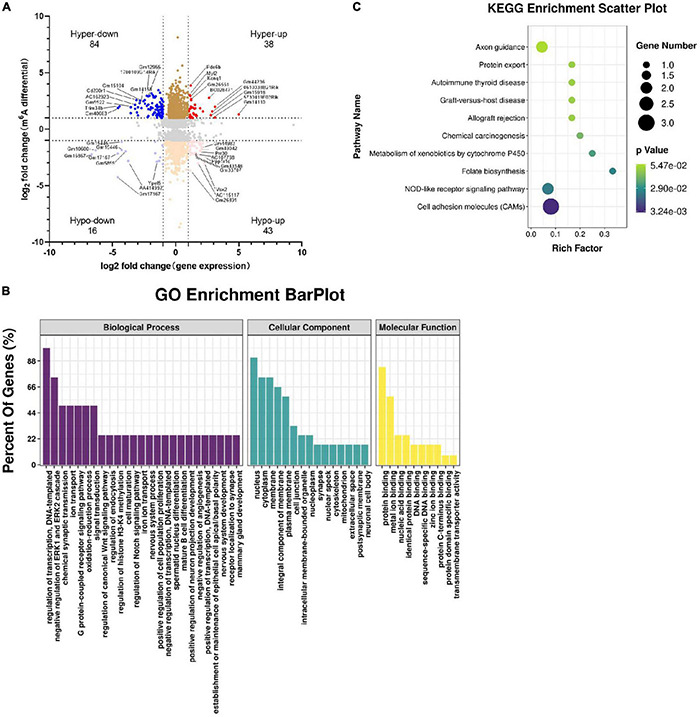
Combined analyses of m6A-RIP-seq and RNA-seq data. Genes whose expression and m6A methylation differed significantly between Tyrobp–/– and wild-type mice were analyzed in terms of their (A) four-quadrant distribution (see Results), (B) major GO terms, and (C) top 10 KEGG pathways. Fold change ≥ 2 or fold change ≤ –2 and P < 0.05, nine mice were used in each group.
