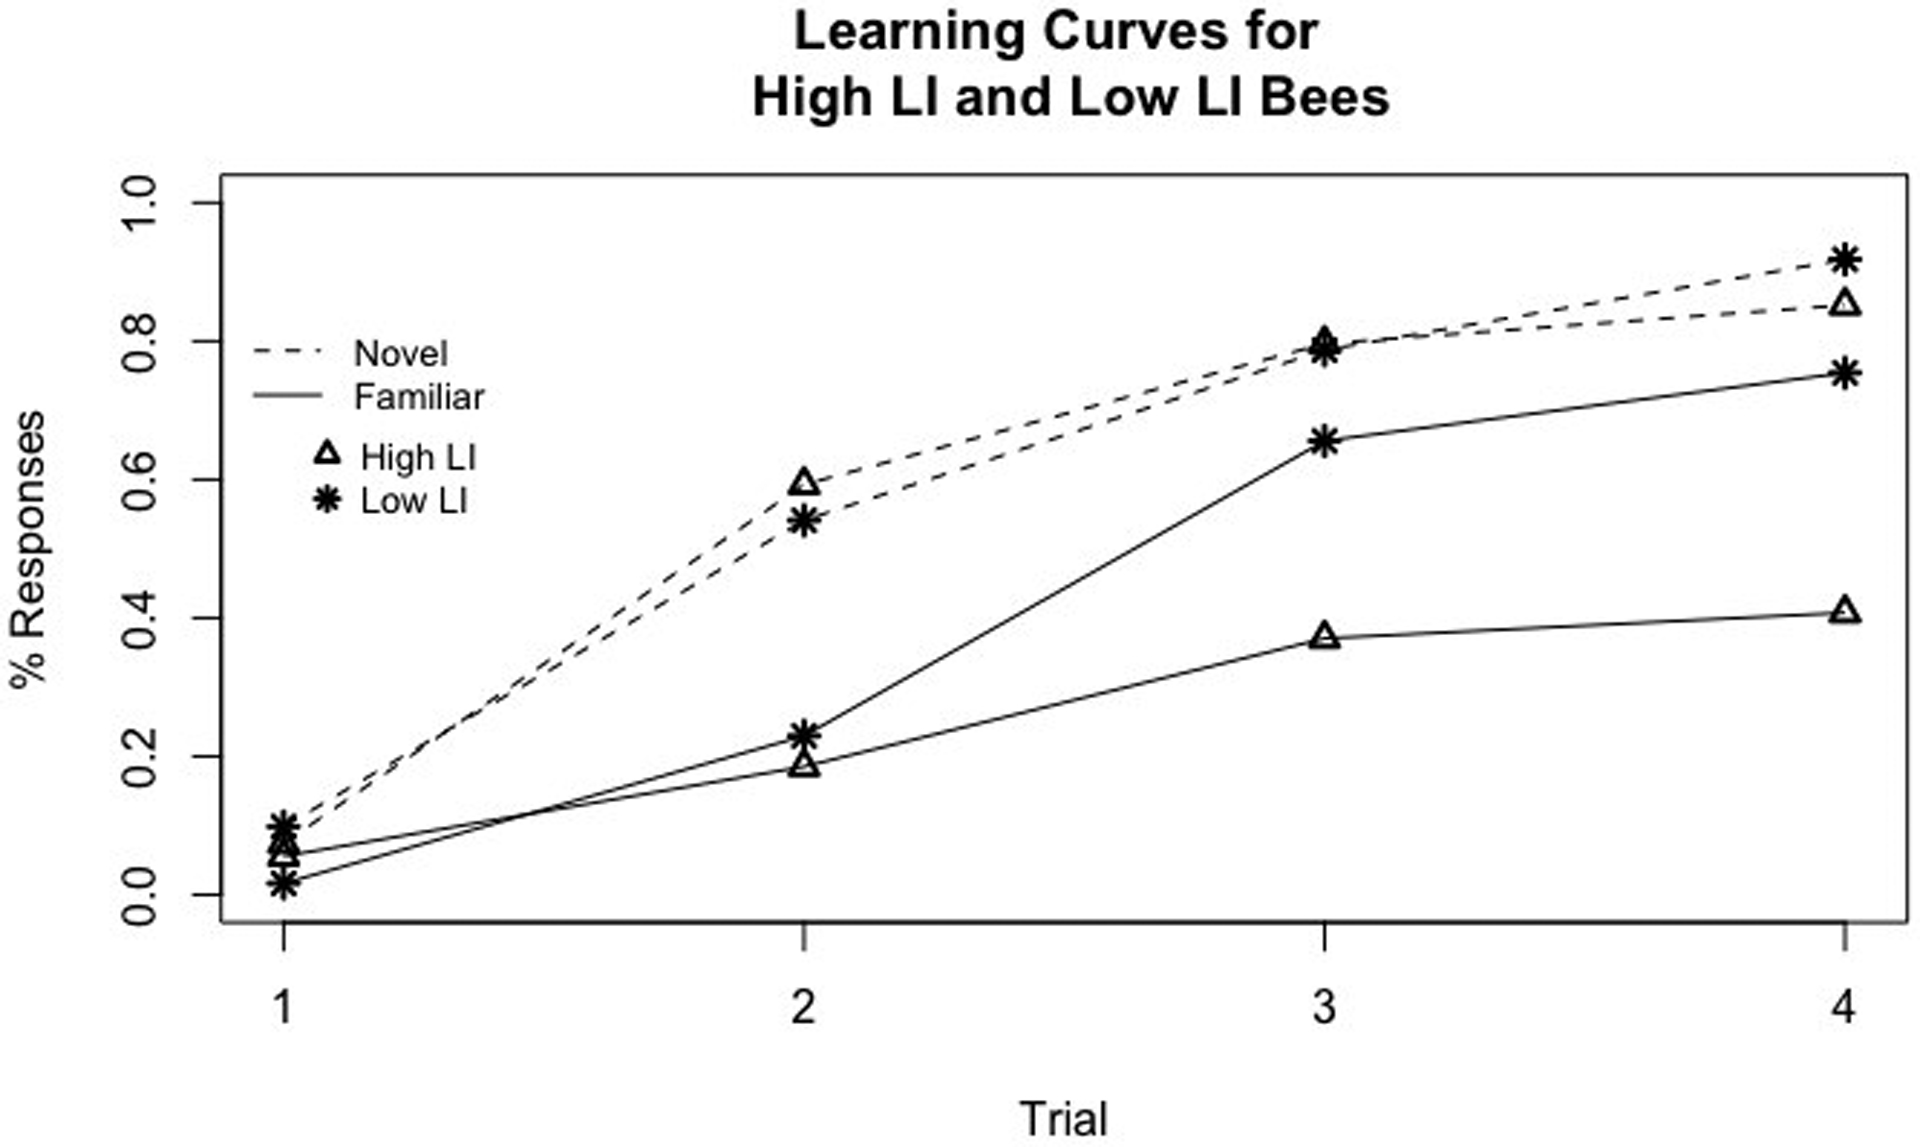
Fig. 1.

Learning curves of LI phenotypes to a familiar and novel odor after the LI assay. Percent PER response over four trials are shown. Dashed lines represent the novel odor, while solid lines represent the familiar odor. Stars indicate low LI responses and triangles represent high LI responses
