Fig. 3.

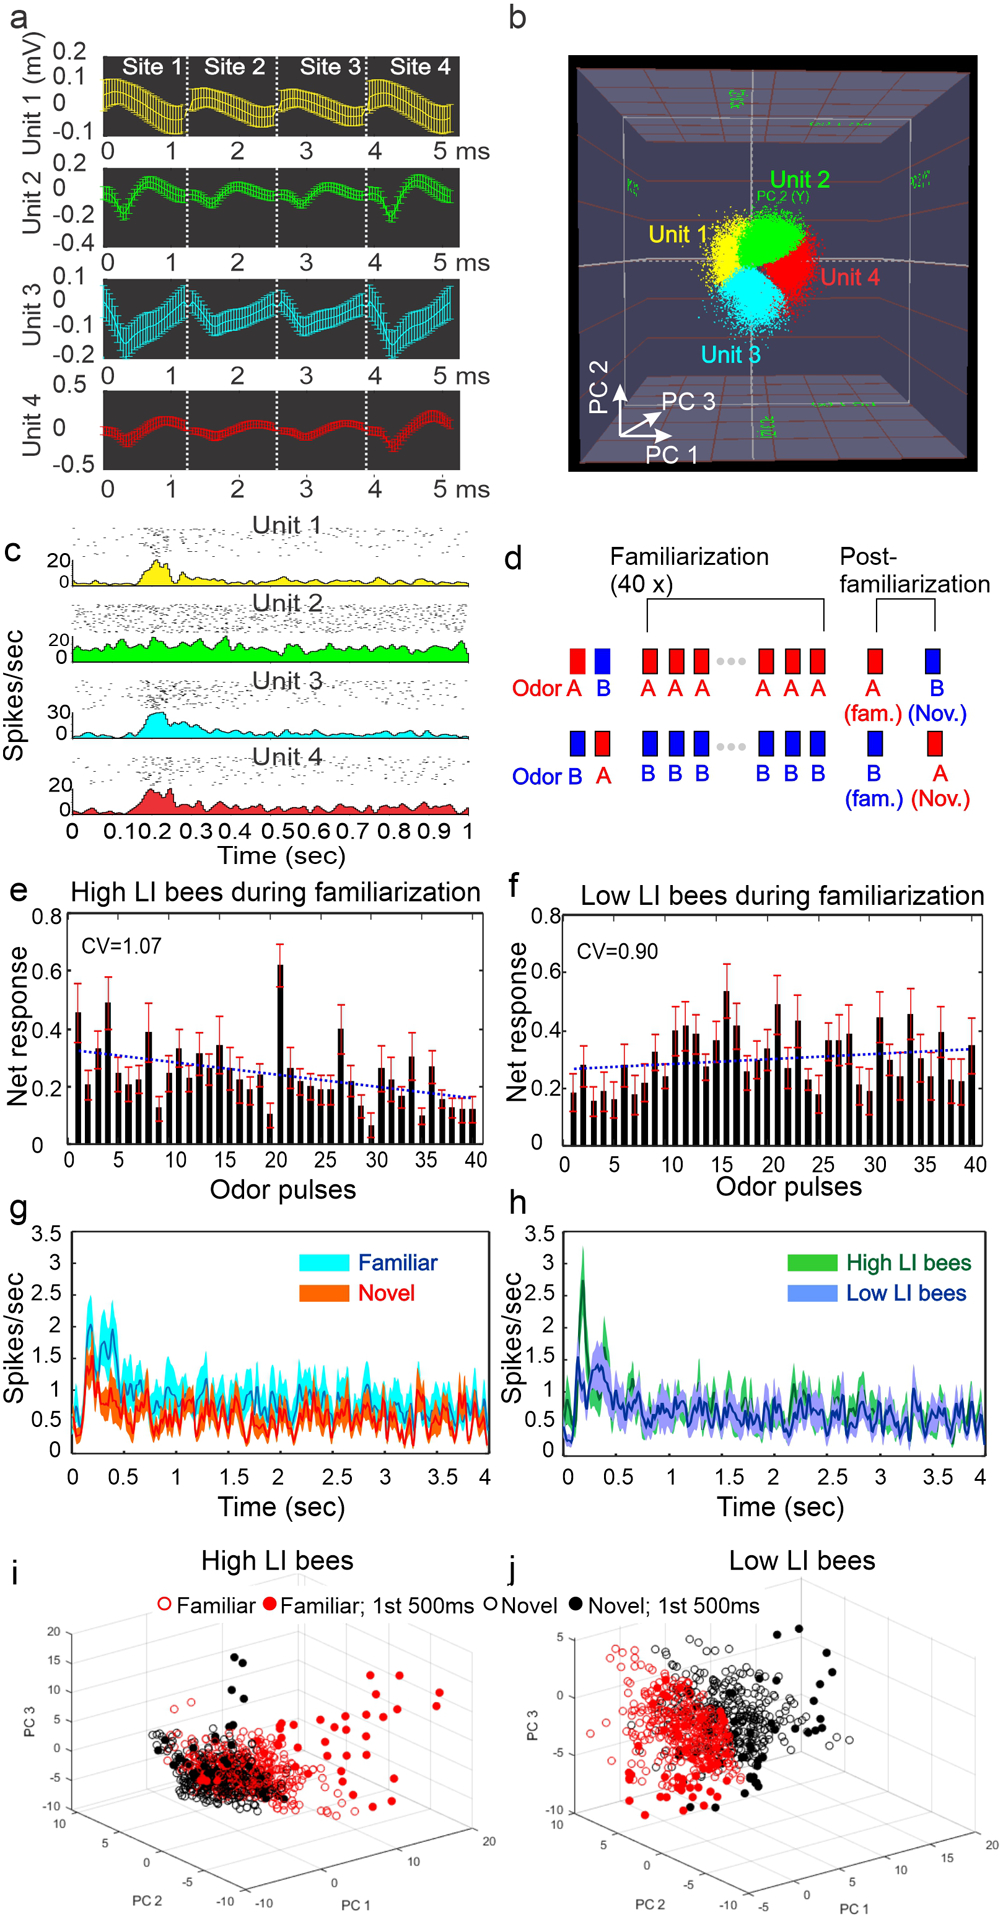
Neural responses to familiar and novel odors. Individual units were separated from extracellularly-recorded waveforms (a) based on their distribution in the 3D principle-component space (b). The responses of the 4 units in (a) are shown with their raster plots (40 stimulations) and peristimulus time histograms (PSTH) (c). Unit 2 did not produce an obvious response. Familiarity (or novelty) to odor A or B was introduced by stimulating the animal repeatedly 40 times with odor A or B (inter-pulse interval = 5 min; 4 sec duration) without any reward or punishment during the familiarization phase, and later tested during the post-familiarization phase (d). The averaged net responses (mean ± SE) over the 40x repeated stimulation in the high LI bees (e) and low LI bees (f) show a large amount of trial-to-trial variation. The net response within a unit (n=13 in high LI bees; n=12 in low LI bees) was normalized to the maximum of the 40 responses. The blue dotted lines represent 1st degree polynomial regression. CV: coefficient of variation. In Panel (g), the PSTHs (mean ± SE) from all AL units regardless the type of bees show stronger response to the familiar odor (cyan) than to the novel odor (red) after familiarization. Similarly, the PSTHs from the high LI bees (green) show a higher transient response shortly after odor stimulation than the low LI bees (blue) (h). In both panels, odor onset was at time zero and stimulation lasted for 4 sec; the spike traces were binned at 10 msec resolution and the curves were Gaussian filtered with a moving window of 3 bins. Principle component analysis revealed that the ensemble dynamics to the familiar and novel odor stimulation in high LI bees were largely overlapped in the entire 4 sec of stimulation window, but showed apparent separation during the first 500 msec (filled red circles vs. filled black circles) (i). In low LI bees, the separation was less pronounced (j).
