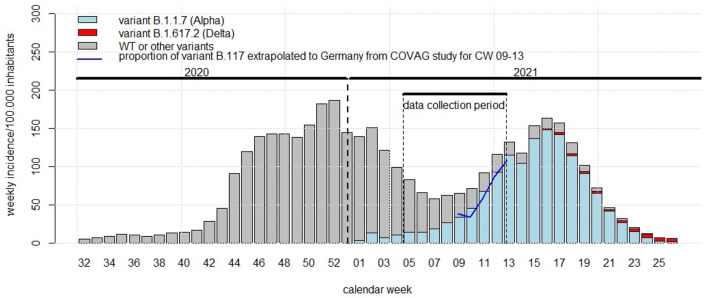
Figure 1.
Framing of the COVAG study (February 1-March 31) into the time course of the COVID-19 pandemic in Germany. Abszissa: calendar week within 2021; ordinate: Germany-wide weekly incidence rate of SARS-Cov-2 infections per 100,000 inhabitants; bars: weekly incidence rates of infections with SARS-CoV-2 variant B.1.1.7 (alpha, blue), variant B.1.617.2 (delta, red), and wild-type or other variants (NIM-type, gray). Blue solid line: proportion of variant B.1.1.7 (alpha) in the COVAG study extrapolated to Germany.

