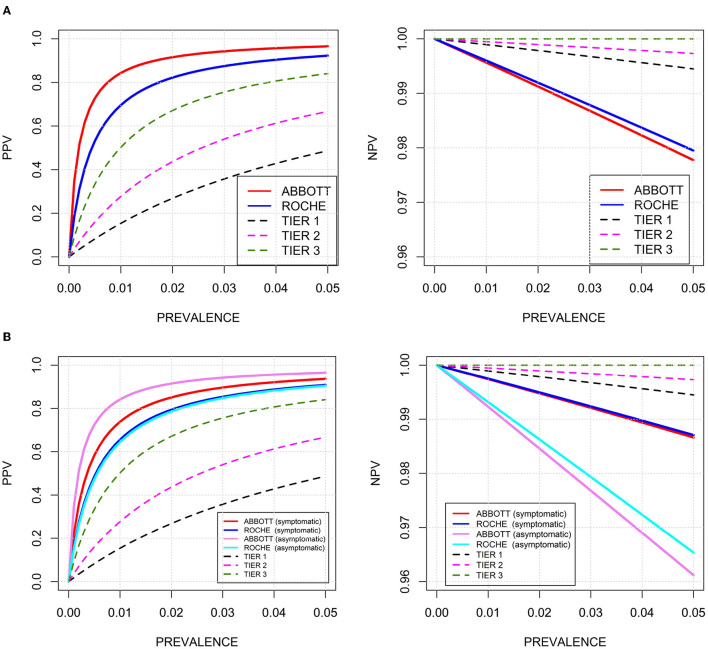
Figure 3.
Predictive values of positive tests (PPV, left) and predictive values of negative tests (NPV, right) of two commercial RDTs for SARS-CoV-2-associated antigens in relation to disease prevalence rates up to 0.05. Black dotted line: hypothetical sensitivity and specificity of 90 and 95% (tier 1); magenta dotted line: hypothetical sensitivity and specificity of 95 and 97.5% (tier 2); green dotted line: hypothetical sensitivity and specificity of 100 and 99% (tier 3). (A) Red solid line: Abbott-RDT; blue solid line: Roche-RDT; (B) stratified according symptomatic and asymptomatic study participants. Red solid line: symptomatic participants, Abbott-RDT; blue solid line: symptomatic participants, Roche-RDT; magenta solid line: asymptomatic participants, Abbott-RDT; light blue solid line: asymptomatic participants, Roche-RDT.

