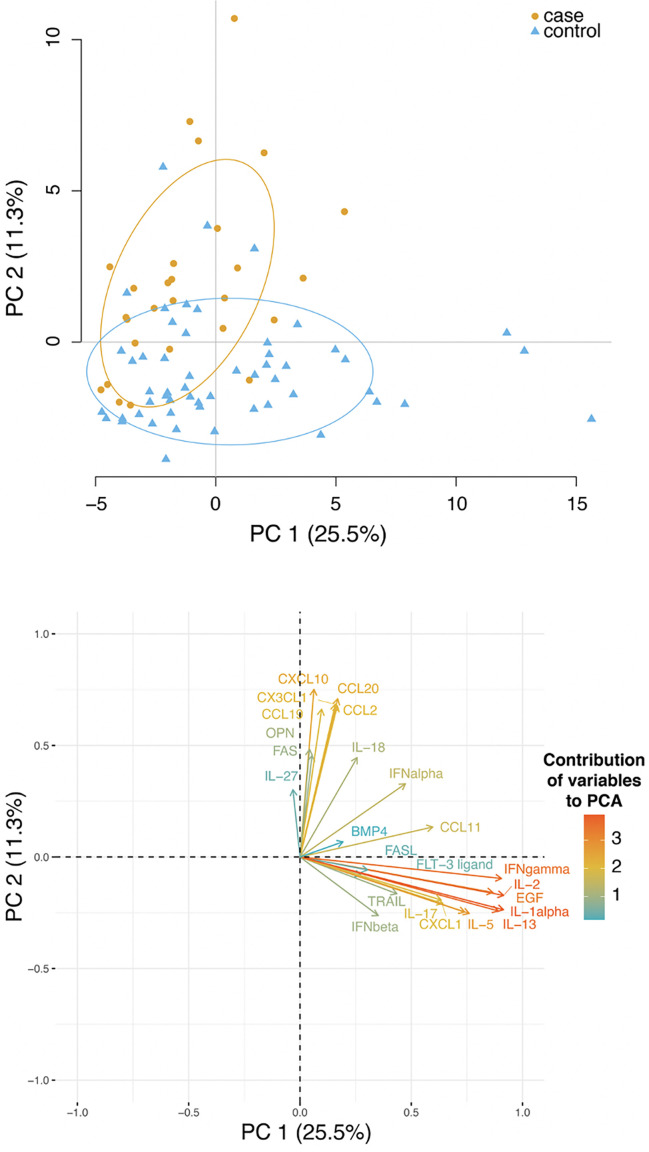
Figure 3.
Plasma level of several cytokines and chemokines stratified controls and cases. Upper panel: principal-component analysis (PCA) analysis of cytokines, chemokines and other soluble molecules quantified across the cohort. Lower panel: a plot displays the variables as vectors, indicating the direction of each variable to the overall distribution. The strength of each variable is represented by colors: orange colour represents a strong contribution, light blue colour represents a milder contribution.

