Fig. 6.

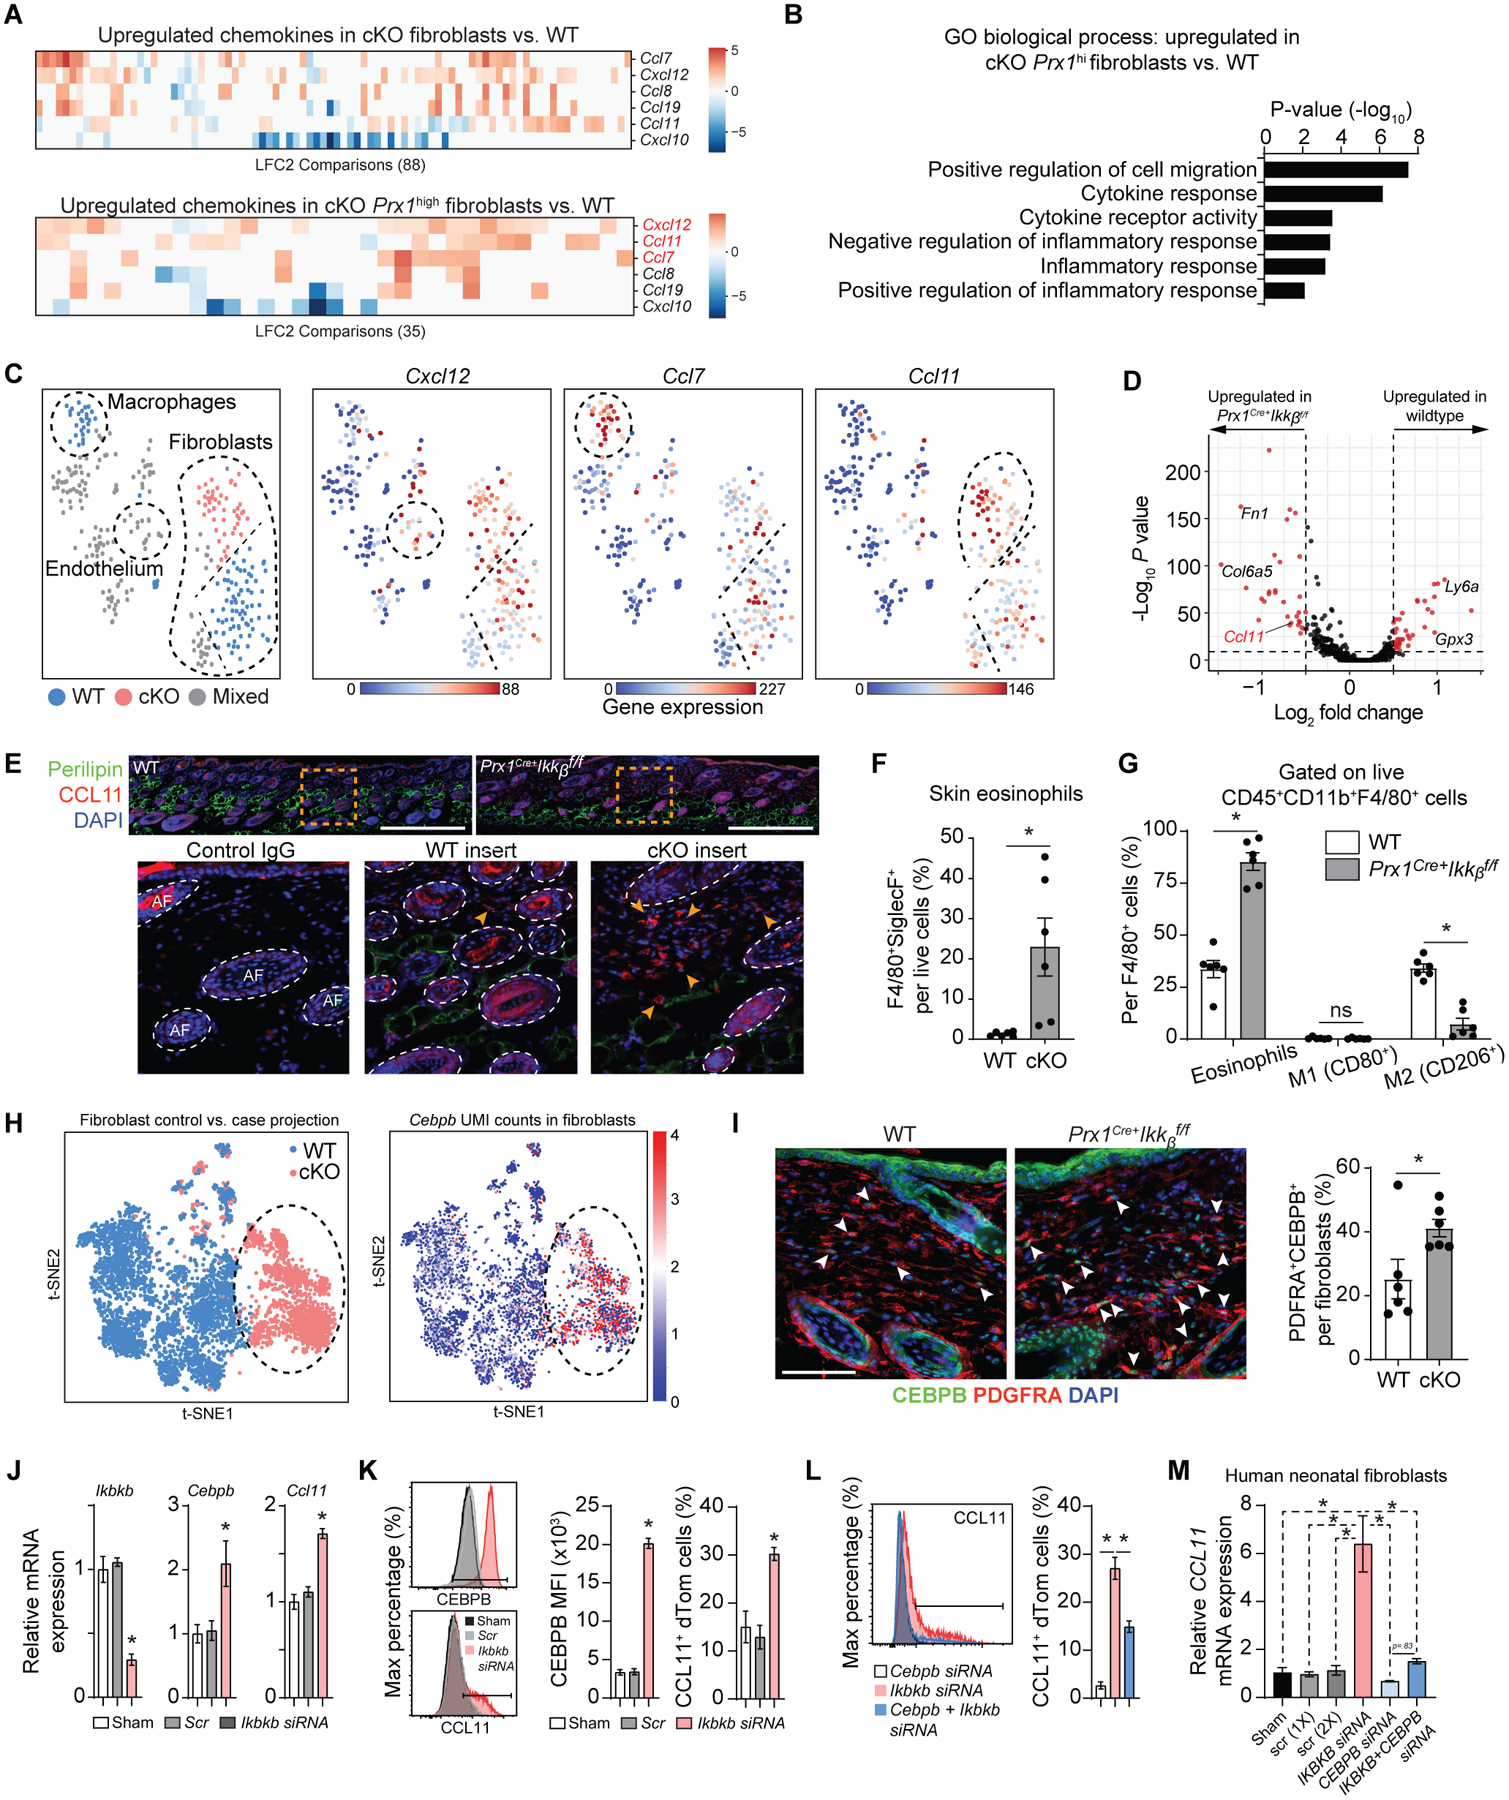
Ikkb deletion causes excessive Ccl11 expression by the fibroblasts and leads to subsequent eosinophilia. A. Pairwise comparisons of chemokine genes from each fibroblast clusters (top) and from Prx1high fibroblasts, comparing WT to Prx1Cre+Ikkbf/f (cKO) group. Notable upregulated chemokine genes were Cxcl12, Ccl11, and Ccl7. LFC2: log2 fold-change. B. Gene ontology (GO) analysis for biological process related to chemotaxis and inflammation based on genes upregulated in Prx1high fibroblasts from cKO group compared to that of WT. C. tSNE plots of iRF-MCL clusters with Cxcl12, Ccl7 and Ccl11 gene expression with notable upregulation of Ccl11 in fibroblast clusters derived from cKO group. D. Volcano plot of genes upregulated in WT and cKO groups using each fibroblast as a datapoint through single cell analysis pipeline established by Seurat and DESeq2 packages. E. In vivo validation of CCL11 protein upregulation by immunofluorescence with CCL11 antibody in ventral skin of 4-week-old WT and cKO mice. Scale bar, 200um. Insert images (orange box) show CCL11+ cells at the border of dermis and subcutaneous layers, as indicated by the arrows. Scale bar: 50um. Representative images are from n=7 each. Isotype IgG control shows autofluorescence in hair follicles. F. Flow cytometry analysis of eosinophil count (CD45+CD11b+F4/80+Siglec-F+) per total live cells, comparing WT versus cKO groups. G. Percentage of Siglec-F+ eosinophils, classically activated macrophages (M1, CD80+), and alternatively activated macrophages (M2, CD206+) per total CD45+CD11b+F4/80+ cells. H. t-SNE plot for 5,136 fibroblasts (3,609 WT and 1,527 cKO) in the scRNA-seq dataset, comparing both WT versus cKO (left) and Cebpb UMI expression (normalized and log10-transformed) (right). I. Immunofluorescence with antibodies specific to CEBPB and PDGFRA in 4-week-old WT and experimental mice (left) and quantification of CEBPB+PDGFRA+ fibroblasts. Scale bar, 50um. J. Quantitative real-time PCR (RT-qPCR) for Ikkb, Cebpb and Ccl11 mRNA in skin fibroblasts with no treatment (sham), scrambled siRNA control (Scr), or Ikkb siRNA (20nM). Cells were isolated from ventral skin of 2-week-old Prx1Cre+R26RdTomato mice and stimulated with low-dose IL4 (5ng/ml) for 12–16h before analysis. K. Flow cytometry analysis of Prx1+ fibroblasts for mean fluorescent intensity of CEBPB (left) or CCL11+ fibroblast numbers (right). Cells were gated for live/dTomato+ expression. L. Quantification of CCL11+ fibroblasts after knockdown with Cebpb siRNA alone, Ikbkb siRNA alone, and Cebpb+Ikbkb siRNA. M. Quantification of CCL11 mRNA by RT-qPCR with IKBKB knockdown alone or IKBKB+CEBPB knockdown in human neonatal fibroblasts without IL4 treatment. F to G. n=6 each. J to M. n=3 each. Data are represented as mean ± SEM of biological replicates. In vitro experiments were repeated twice, and animal experiments were repeated three times. *P<0.05, ns: not significant; Student’s t-test comparing WT to cKO groups (F and G) or one-way ANOVA followed by post-hoc test (J to M).
