Fig. 7.

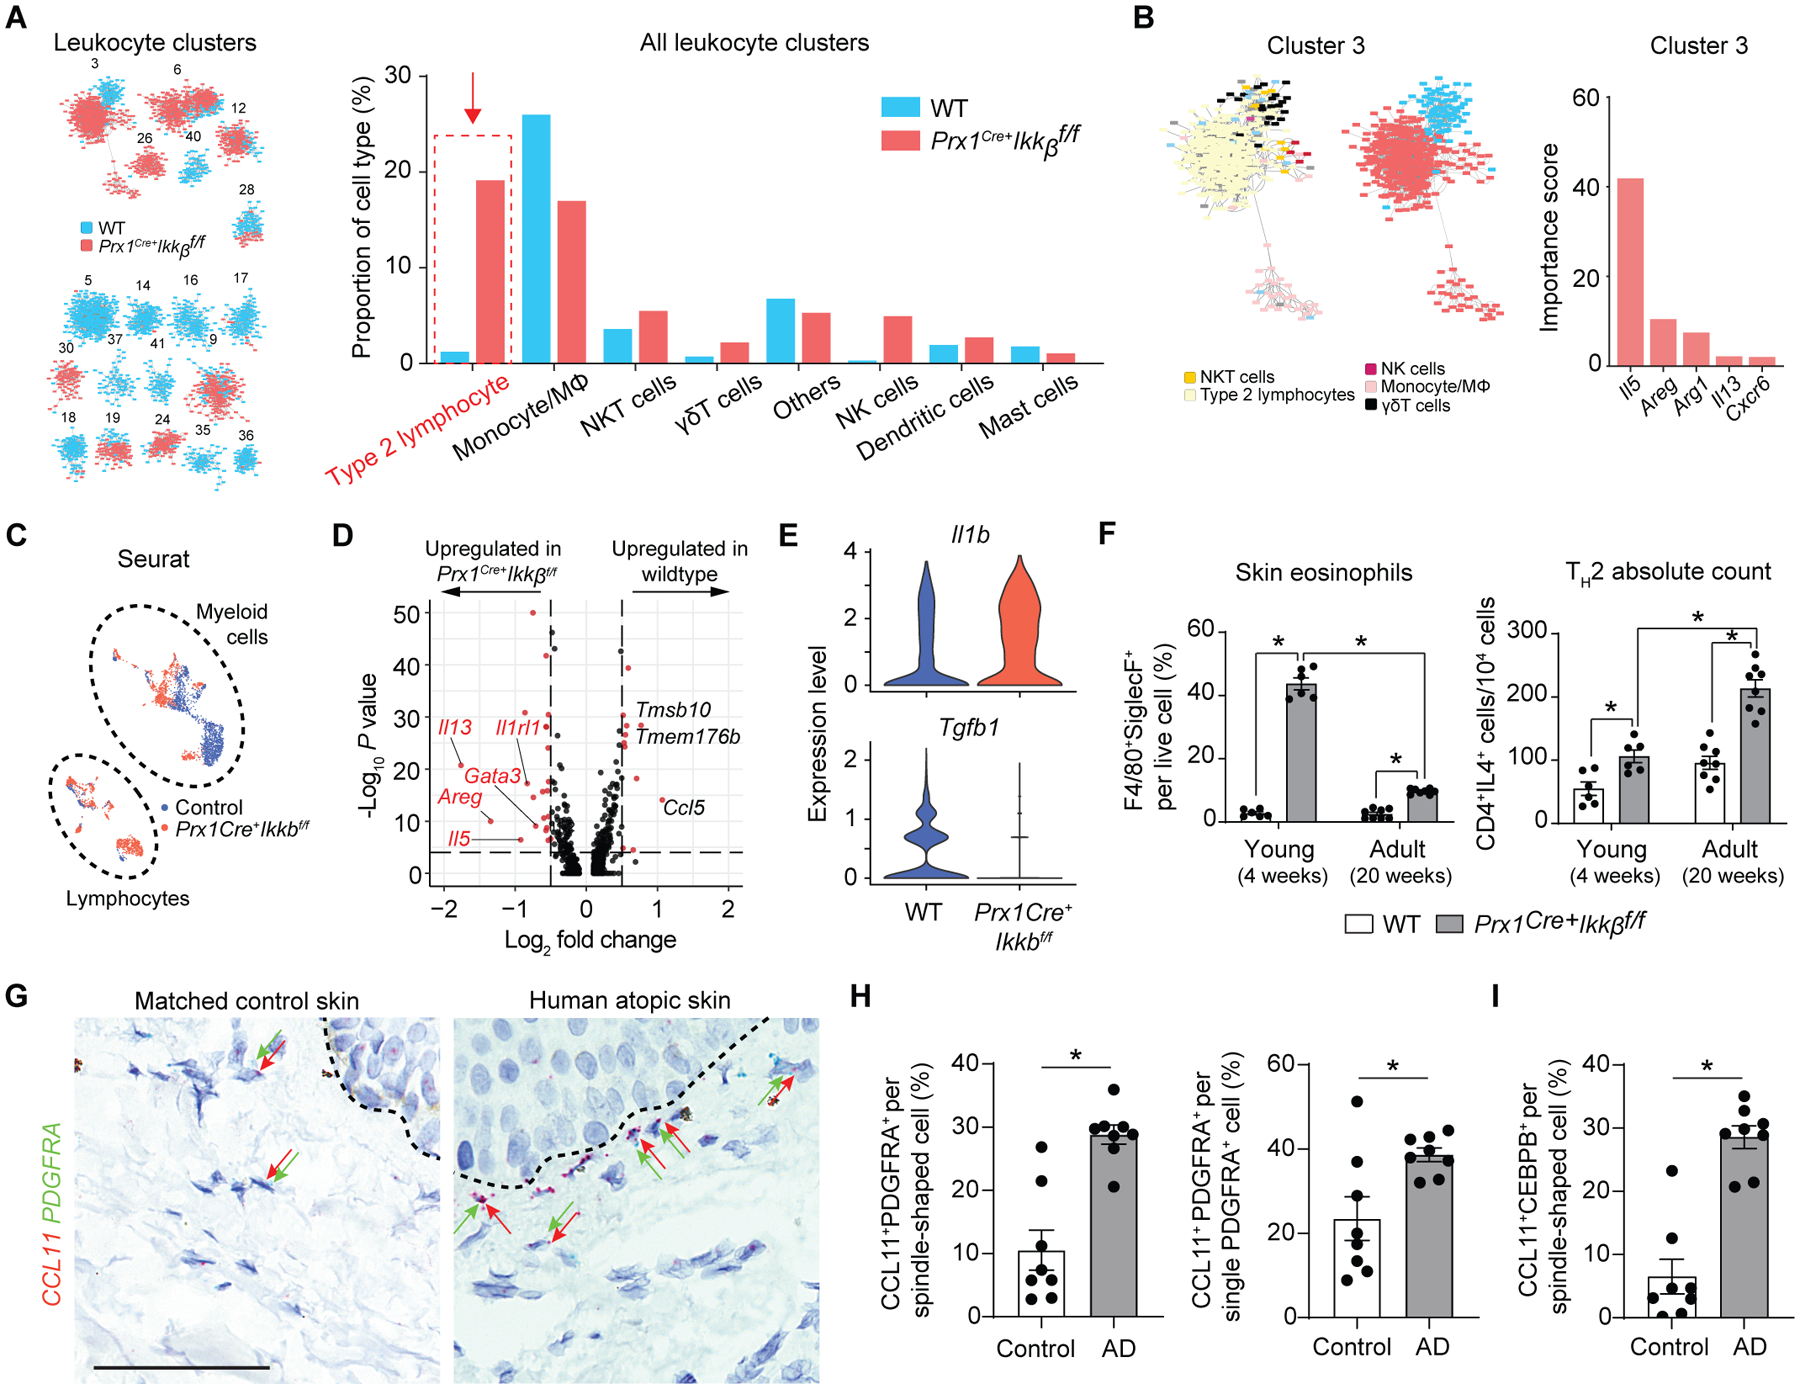
Ikkb deletion in fibroblasts causes a shift in inflammatory phenotype towards type-2 immune response, mimicking atopic skin in humans. A. Leukocyte frequency distribution between control (WT) and Prx1Cre+Ikkbf/f (cKO) groups demonstrating marked increase in Th2 proportion in cKO group. B. Importance scores of genes that determined the largest immune cell cluster (Cluster 3) that is predominated by cells of cKO group. Il5, Areg and Il13 are classic type 2 immune cytokines. C. Seurat clustering of immune cells from WT (blue) and cKO (red) mice; myeloid and lymphoid cell designation was determined by their putative gene expression as shown in fig. S7. D. Volcano plot of genes upregulated in lymphocyte population of WT and cKO groups using Seurat and DESeq2 packages. E. Violin plot of Il1b and Tgfb1 in myeloid cell population between WT and cKO mice. F. Flow cytometry analysis of skin eosinophils and CD3+CD4+IL4+ Th2 cells from young (4-week-old) and adult (20-week-old) WT and cKO mice. n=6–8 each. G. Representative RNAScope images of human control and atopic skin specimens detecting CCL11 (red) and PDGFRA (green dots) signals in dermis. Dashed line demarcates epidermal-dermal junction. Black arrows point to some PDGFRA+ fibroblasts and red arrows to CCL11+ cells. Scale bar, 50um. H. Quantification of double CCL11+PDGFRA+ cells per total spindle-shaped cells (left) and percentage of CCL11+ expressing fibroblasts by normalizing to total PDGFRA+ cells. I. Quantification of CCL11+CEBPB+ spindle-shaped cells in matched control versus human AD skin. n=8 each. Data are represented as mean ± SEM of biological replicates. Animal experiments were repeated three times, and RNAScope was repeated twice. *P<0.05; F, two-way ANOVA followed by Tukey’s post-hoc test; H and I, Student’s t-test.
