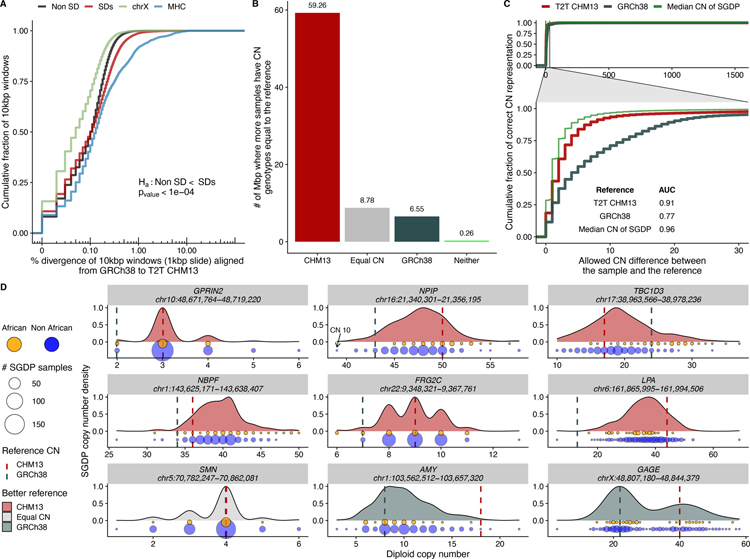
Fig. 3. SD single-nucleotide and copy number variation.
A) Sequence divergence (% in 10 kbp bins) based on syntenic alignments between GRCh38 and T2T-CHM13 for SDs (red), and unique genomic regions (black). SD regions show significantly more divergence when compared to unique sequence (black) and chromosome X (blue) but less than the MHC regions (green). B) Copy number of SD regions that are previously unresolved or structurally different in T2T-CHM13 compared to GRCh38 based on 268 human genomes from the Simons Genome Diversity Project (SGDP). The histogram shows the number of Mbp where more samples support the copy number of the given assembly [T2T-CHM13 (red), GRCh38 (blue), neither (green), or both equally (equal copy number)]. C) Empirical cumulative distribution showing how many samples genotype correctly with either GRCh38 or T2T-CHM13 as a function of the allowed difference between sample and reference copy number. The inset shows the area under the curve (AUC) calculation for both references allowing a maximum copy number difference of 30. The green curve shows an in silico reference made using the median copy number of the SGDP samples at each site. D) Genic copy number variation. Copy number variation in nine gene families are shown (generated with SGDP) and distribution is colored according to which reference better reflects the median copy number; GRCh38 generally underestimates copy number (vertical lines) and Africans (orange) tend to show higher copy number than non-Africans (blue); circle size indicates # of samples.

