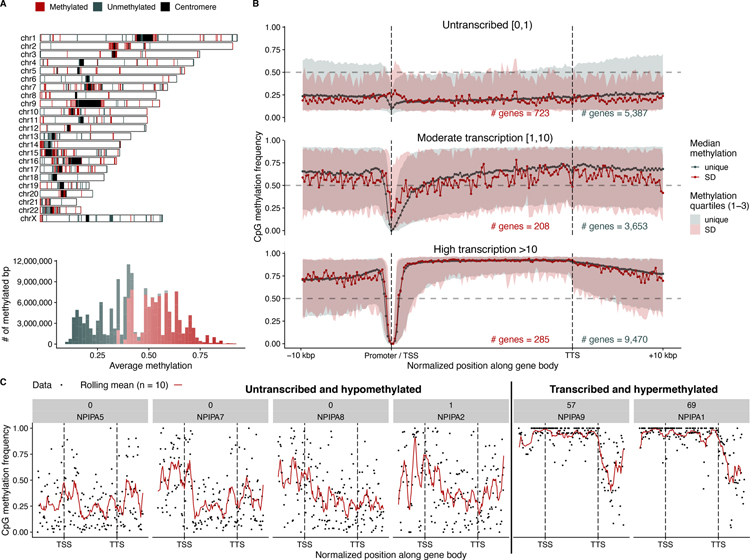
Fig. 6. SD methylation and gene transcription.
A) Methylated (red) or unmethylated (blue-gray) SD blocks in the CHM13 genome based on processing ONT data. The histogram shows the distribution of average methylation across these regions. B) Median methylation signal of SD (red) and unique (blue-gray) genes stratified by their Iso-Seq expression levels in CHM13. The filled intervals represent the 25 and 75 quartiles of the observed data. Vertical lines indicate the position of the transcription start site (TSS) and the transcription termination site (TTS). C) Methylation signal across the recently duplicated NPIPA gene family in CHM13, showing increased methylation in transcriptionally active copies. Black points are individual methylation calls, and the red line is a rolling mean across 10 methylation sites. The labels in gray show the number of CHM13 Iso-Seq transcripts and the gene name.

