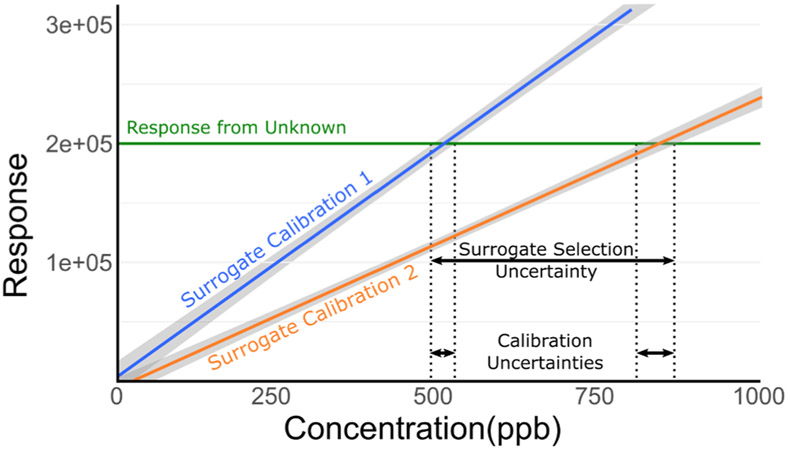
Fig. 4.
Estimation of the concentration of an unknown compound from a measured intensity (horizontal green line) and multiple surrogate calibration curves (blue and orange lines) with 95% prediction bands (grey envelopes). In this theoretical example, the uncertainty incurred from surrogate selection (i.e., calibration curve 1 vs. 2) far outweighs the calibration estimate uncertainty associated with either individual curve.

