Figure 1.
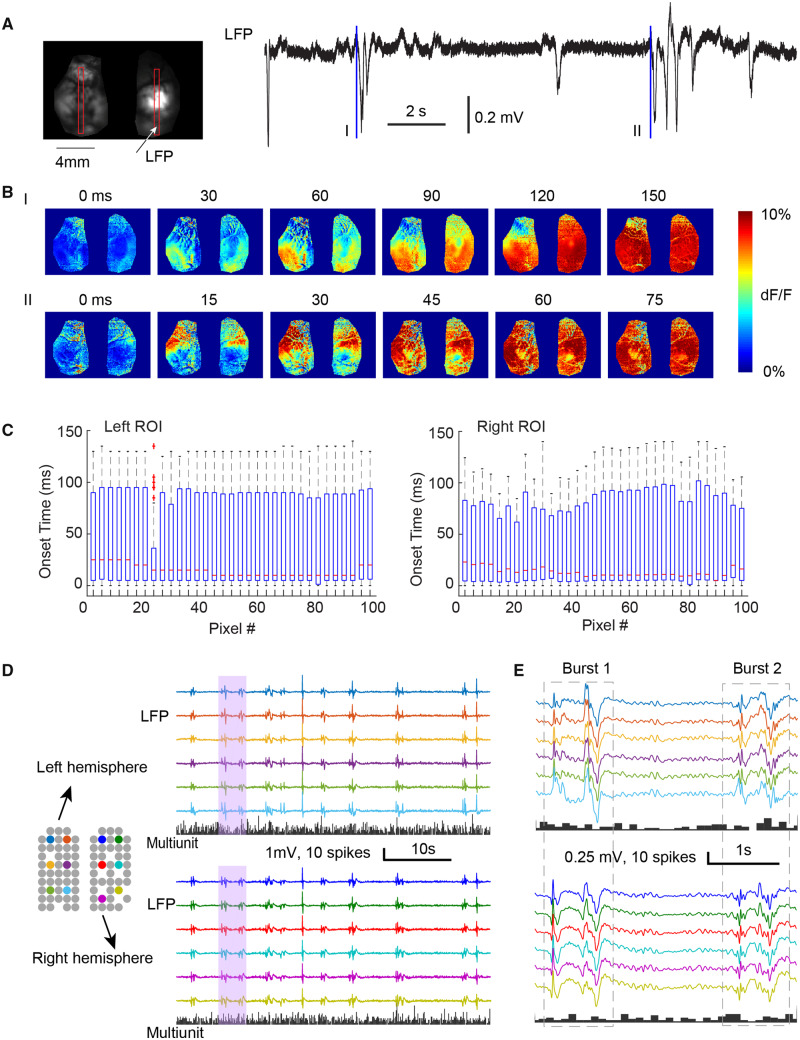
The spatiotemporal dynamics of burst suppression in non-epileptic cortex. (A) Example of the onset of two bursts in wide field calcium imaging. Left: The field of view shows both hemispheres in one preparation. Two vertical red boxes indicate two regions of interest (ROI), from which the onset time is calculated. Right: The LFP recording of isoflurane induced burst suppression. Two blue lines indicate the onset (t = 0 ms) of two bursts (I and II). (B) The spatiotemporal evolution of calcium fluorescence intensity during the two bursts showed in A. Both bursts show bilaterally symmetric onset and propagation patterns. (C) The box-and-whisker plots of the onset time of calcium signal from each pixel in two vertical regions of interest (left and right) (n = 51 interictal bursts). For each box, the central mark indicates the median, and the bottom and top edges of the box indicate the 25th and 75th percentiles, respectively. The whiskers extend to the most extreme data points not considered outliers, and the outliers are plotted individually using the plus symbol. (D) Multi-electrode array recording of bursts in normal cortex. Grey circles show locations of each electrode, missing circles indicate non-functional electrodes. Colours demonstrate electrodes whose LFP traces shown on the right. The histograms below show each hemisphere’s multiunit spike counts every 100 ms. Bursts occur intermittently with globally symmetric spread of LFP but are with sparse MUA. Pink shaded vertical bar is expanded and displayed in E. (E) The array recording of two bursts with higher temporal resolution.

