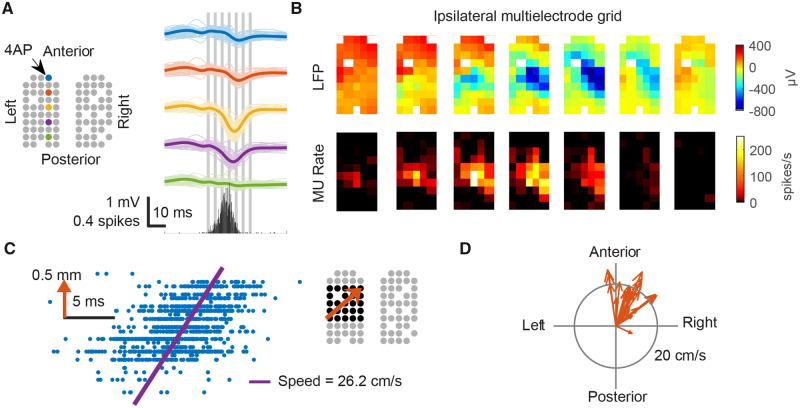
Figure 4.
Ipsilateral focal neural activity formed traveling waves propagating towards the epileptic focus. (A) Left: Cartoon illustrates locations of working electrodes and coloured electrodes indicate sources for LFP traces on the right. Thin lines indicate each event. Thick lines indicate averages. The bottom graph shows ipsilateral hemisphere’s averaged multiunit spike counts every 1 ms. (B) The averaged spatiotemporal evolution of LFPs and MUA. The timing of each frame is indicated by the grey vertical bars in A. Notice the sequential appearance of multiunit (MU) spikes and LFP discharges (left bottom to top right). (C) Linear regression (data from the black-marked electrodes, right inlet, gathered from all ipsilateral neural events) shows that multiunit spikes (blue dots) were detected sequentially in space, propagating toward the epileptic focus (orange arrow, right inlet). Vertical axis of the raster plot (left inlet) indicates each electrode’s position along the propagation path (orange arrow). Horizontal axis indicates timing of multiunit spikes. (D) Estimated velocity of each individual traveling wave. Notice the consistent propagation direction.

