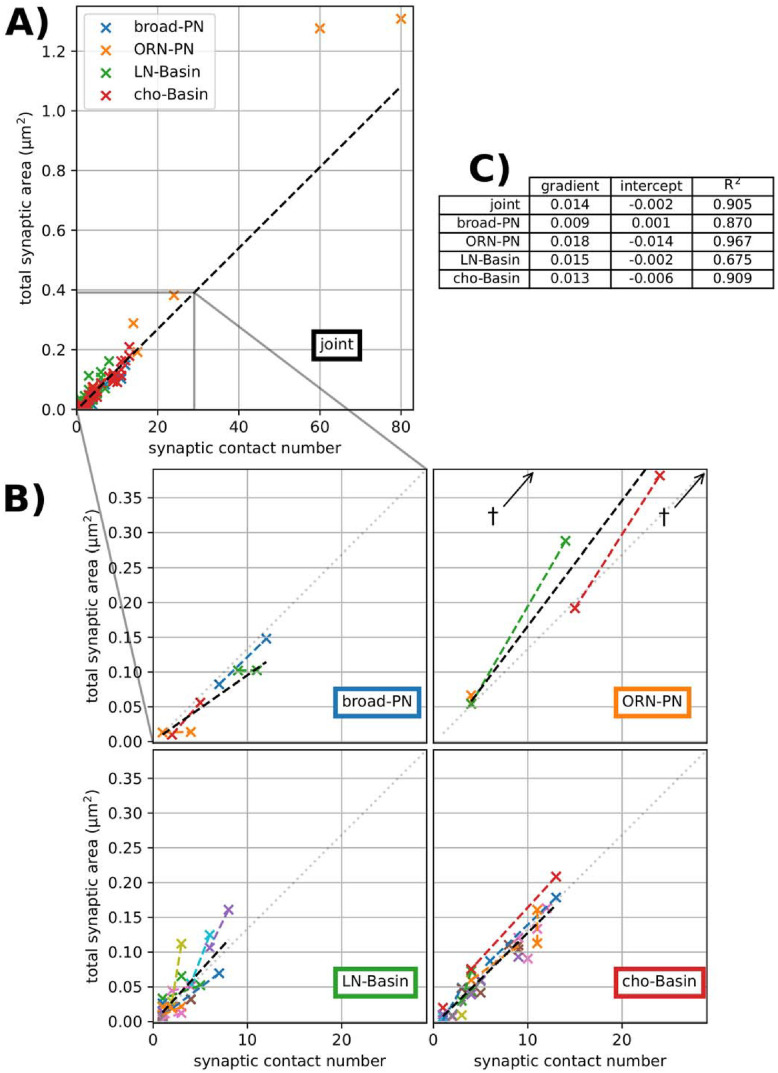
Fig 3. Least-squares linear regressions of contact number vs area for each edge.
Weighted by the reciprocal of the contact number to reduce leverage by high-n edges. A) Joint regression line for all edges (black dashed line), y = 0.014x + 0.002, R2 = 0.905. B) For each circuit, a zoomed-in region of A, showing the joint regression (grey dotted line) and the circuit-specific regression line (black dashed line). Left-right pairs, when unambiguous, are shown in the same colour and joined with a dashed line of that colour. †shows outliers beyond the limits of the ORN-PN plot. C) Table of regression line gradient (μm2count−1 to 3 decimal places), y-intercept (μm2 to 3 decimal places) coefficient of determination R2 (to 3 decimal places).

