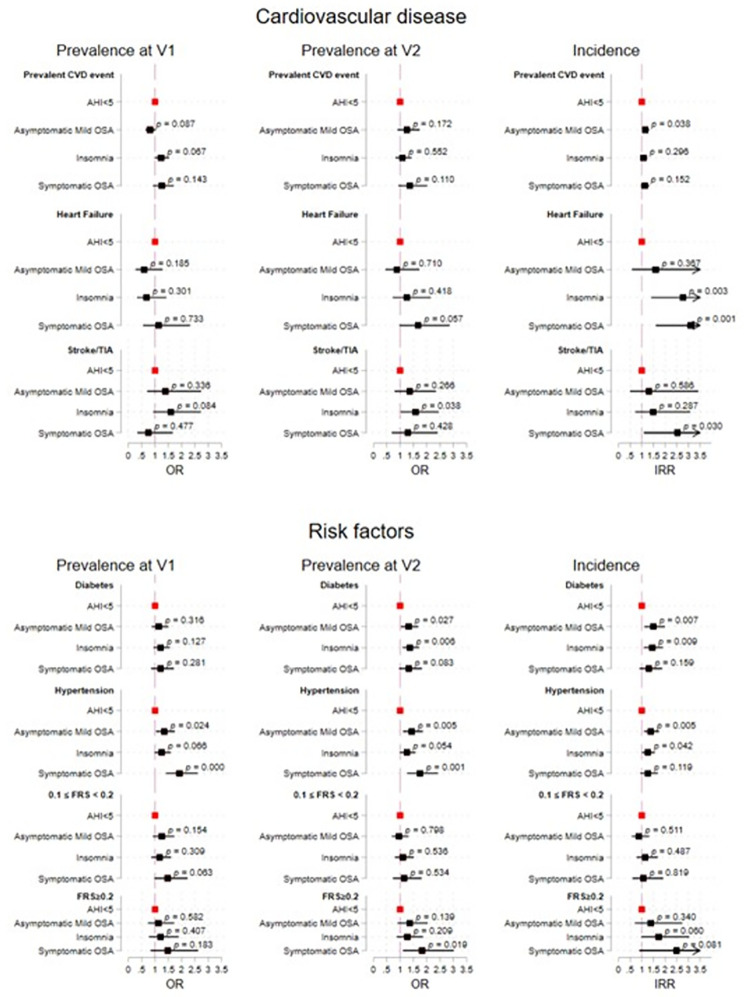
Fig 2. The estimated parameters and inferential statistics for the associations of OSA phenotypes with the cardiovascular disease and risk outcomes.
AHI<5 is the reference group. The prevalence at V1 models are adjusted for BMI, cigarette usage, alcohol usage, HDL cholesterol, total, cholesterol, and triglycerides all at V1. The prevalence at V2 models are adjusted for BMI, cigarette usage, alcohol usage, HDL cholesterol, total, cholesterol, and triglycerides all at V2. The incidence models are adjusted for BMI, cigarette usage, alcohol usage, HDL cholesterol, total, cholesterol, and triglycerides all at V1.

