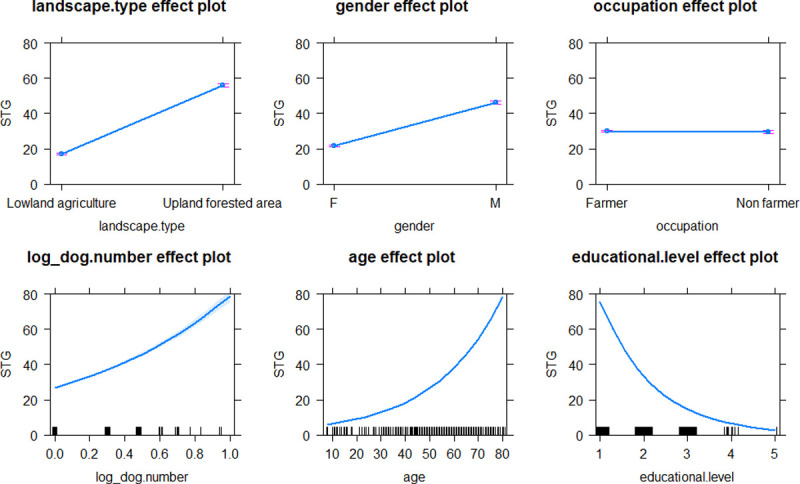
Fig 3. Effect plots of explicative variables after best model fitting with GLM to estimate level of STG exposures in inhabitants of Saen Thong Subdistrict, Nan Province.

Marks on the X-axis represent individual observations.

Marks on the X-axis represent individual observations.