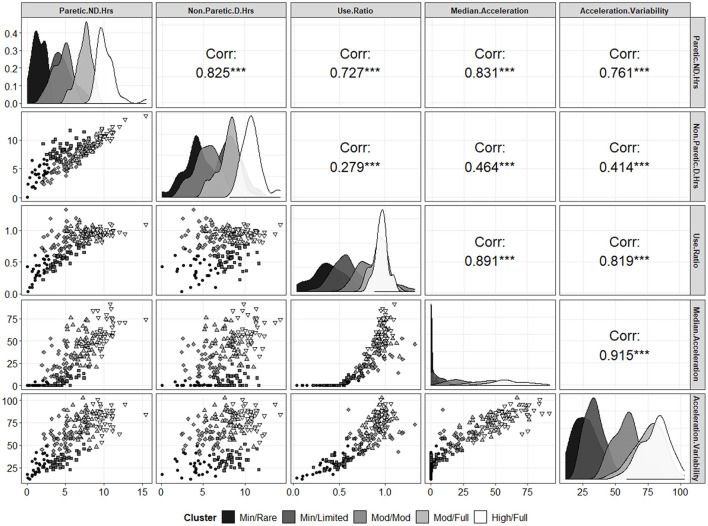
Figure 2.
Scatterplot matrix of the 5 input variables as a function of the 5 different clusters. The diagonal shows density plots (i.e., the univariate distribution) of each input variable as a function of the different clusters. The lower left panels show the bivariate distributions for each pair of variables with the point shapes and gray scales corresponding to the different clusters (see legend). The upper right panels show the Spearman rank order correlations for each pair of variables (on the whole, ignoring clusters). ***p < 0.001.

